
Same Model, More Incidents Closed
We put six AI models behind Resolve, the CloudThinker incident agent, and let each one work the same 21 live Kubernetes faults. The agent was the same, the sandbox was the same, and the prompt was the same. Only the model changed.
Three results came out of it.
- With Claude Opus 5, Resolve resolved 18 of 21 faults end to end. On the public leaderboard for the same 21 faults, the best row today is 17 of 21.
- Opus 5 was the only model that never patched a component it could not name. Every other model did that between two and six times.
- Model choice moved the resolution rate from 38% to 86% inside one agent. The harness sets the ceiling. The model decides how close you get to it.
Everything below is self-run. We say where our setup matches the public leaderboard and where it does not.
The benchmark
SREGym is a live benchmark for SRE agents from the University of Illinois and the University of Toronto. It deploys a real application on a Kubernetes cluster, injects one fault, and grades the agent in two stages.
- Diagnosis. An LLM judge reads the agent's write-up against a checklist and passes it only if the agent named the faulty component and characterised the fault correctly.
- Mitigation. A problem-specific oracle checks the live cluster. It passes only if the application actually works again.
End to end is the intersection. Both stages must pass on the same run. An agent can name the cause and fail to fix it, or fix it while naming the wrong thing. Both happen, and both show up in the tables below.
We ran the SREGym-Lite cohort: 21 faults across four applications, the same 21 problem ids the public leaderboard uses. One of them, duplicate_pvc_mounts_social_network, puts its fault inside the tracing service, and our diagnosis prompt tells the agent to treat tracing as out of scope. Every model scored zero on it. We left it in every table because the leaderboard denominator is 21.
Resolve against the public leaderboard
Model names are shown without the serving provider. Effort level is in parentheses where the source publishes it.
| Rank | Agent | Model | Diag. % | Mit. % | E2E % | TTD s | TTM s | Tokens / run |
|---|---|---|---|---|---|---|---|---|
| 1 | CloudThinker Resolve (self-run) | Claude Opus 5 (high) | 95.2 | 85.7 | 85.7 | 938 | 1283 | 1.93M |
| 2 | Codex | GPT-5.6 Sol (max) | 95.2 | 85.7 | 81.0 | 211 | 397 | 1.42M |
| 3 | Claude Code | Claude Opus 5 | 92.1 | 82.5 | 76.2 | 210 | 420 | 1.64M |
| 4 | Codex | GPT-5.6 Terra (max) | 85.7 | 79.4 | 69.8 | 215 | 416 | 1.68M |
| 5 | Codex | GPT-5.6 Luna (max) | 87.3 | 79.4 | 68.3 | 284 | 493 | 2.74M |
| 6 | Codex | GPT-5.6 Sol (medium) | 77.8 | 71.4 | 58.7 | 108 | 271 | 0.77M |
| 7 | Claude Code | Claude Sonnet 5 | 63.5 | 69.8 | 55.6 | 272 | 450 | 2.95M |
| 8 | Claude Code | Claude Opus 4.8 | 66.7 | 63.5 | 52.4 | 324 | 503 | 1.66M |
How to read the CloudThinker row. It is self-run and it is not an official leaderboard submission. We ran the SREGym-Lite-0904 cohort (21 faults, SREGym commit f125857) on our own infrastructure on 6 September 2026, with our benchmark kit 1.7.0. One cold run per fault, no memory carried between faults, noise injection off, diagnosis judged by Claude Sonnet 4.6 as in the SREGym paper. The leaderboard rows aggregate three runs per fault, and the leaderboard does not publish its judge model or its noise setting. Leaderboard values were fetched on 8 September 2026.
Two things stand out.
Diagnosis and mitigation tie the top row. End to end does not. Resolve with Opus 5 and Codex with GPT-5.6 Sol both diagnose 95.2% and mitigate 85.7%. Resolve closes more faults end to end because its two stages stay coupled: when it named the resource correctly, it fixed that resource. It had zero runs in the "fixed it, named it wrong" column. Codex with Sol passed 18 diagnoses and 18 mitigations but only 17 on the same fault.
Resolve is slower. Time to mitigation is three times the leaderboard's. Part of that is measurement: our TTD includes the judge's grading time, and our TTM includes the TTD. Part of it is design: Resolve runs a verification pass before it calls a fix done, and it stops for an approval gate on every production-changing action. We would rather report a slow verified fix than a fast unverified one, but the number is the number.
One more caveat on the comparison. The gap between 18 of 21 and 17 of 21 is one fault. On a single run, that is inside sampling noise. The honest claim is that Resolve with Opus 5 matches the top of the board, not that it beats it.
Six models, one harness
Now the same 21 faults, all six models, all inside Resolve. This is the table we actually use to decide what to ship.
| Model | Diag. % | Mit. % | E2E % | 95% CI | TTM s | Tokens / run | Cost per resolved fault |
|---|---|---|---|---|---|---|---|
| Claude Opus 5 (high) | 95.2 | 85.7 | 85.7 | 65 to 95 | 1283 | 1.93M | $9.53 |
| GPT-5.6 Sol (high) | 85.7 | 71.4 | 61.9 | 41 to 79 | 890 | 1.75M | $12.19 |
| GLM-5.3 (low) | 71.4 | 66.7 | 57.1 | 37 to 76 | 1017 | 3.45M | $1.52 |
| GPT-5.6 Luna (max) | 76.2 | 71.4 | 57.1 | 37 to 76 | 1278 | pending | $1.83 |
| Claude Sonnet 5 (high) | 52.4 | 57.1 | 42.9 | 25 to 63 | 1262 | 6.22M | $5.17 |
| DeepSeek V4 Flash (low) | 57.1 | 57.1 | 38.1 | 21 to 58 | 1097 | pending | $0.11 |
Same contract for every row: one cold run per fault, noise off, prompt mode fixed, judge Claude Sonnet 4.6. Cost is what we were billed, divided by the faults that model resolved. Opus 5, Sol, and Sonnet 5 ran on three parallel lanes; the other three ran on five, so compare times only within the same group. The DeepSeek price is a floor because 19% of its tokens were not priced. The Luna price is recomputed from token counts at list rates because our tracing stopped pricing that model mid-campaign.
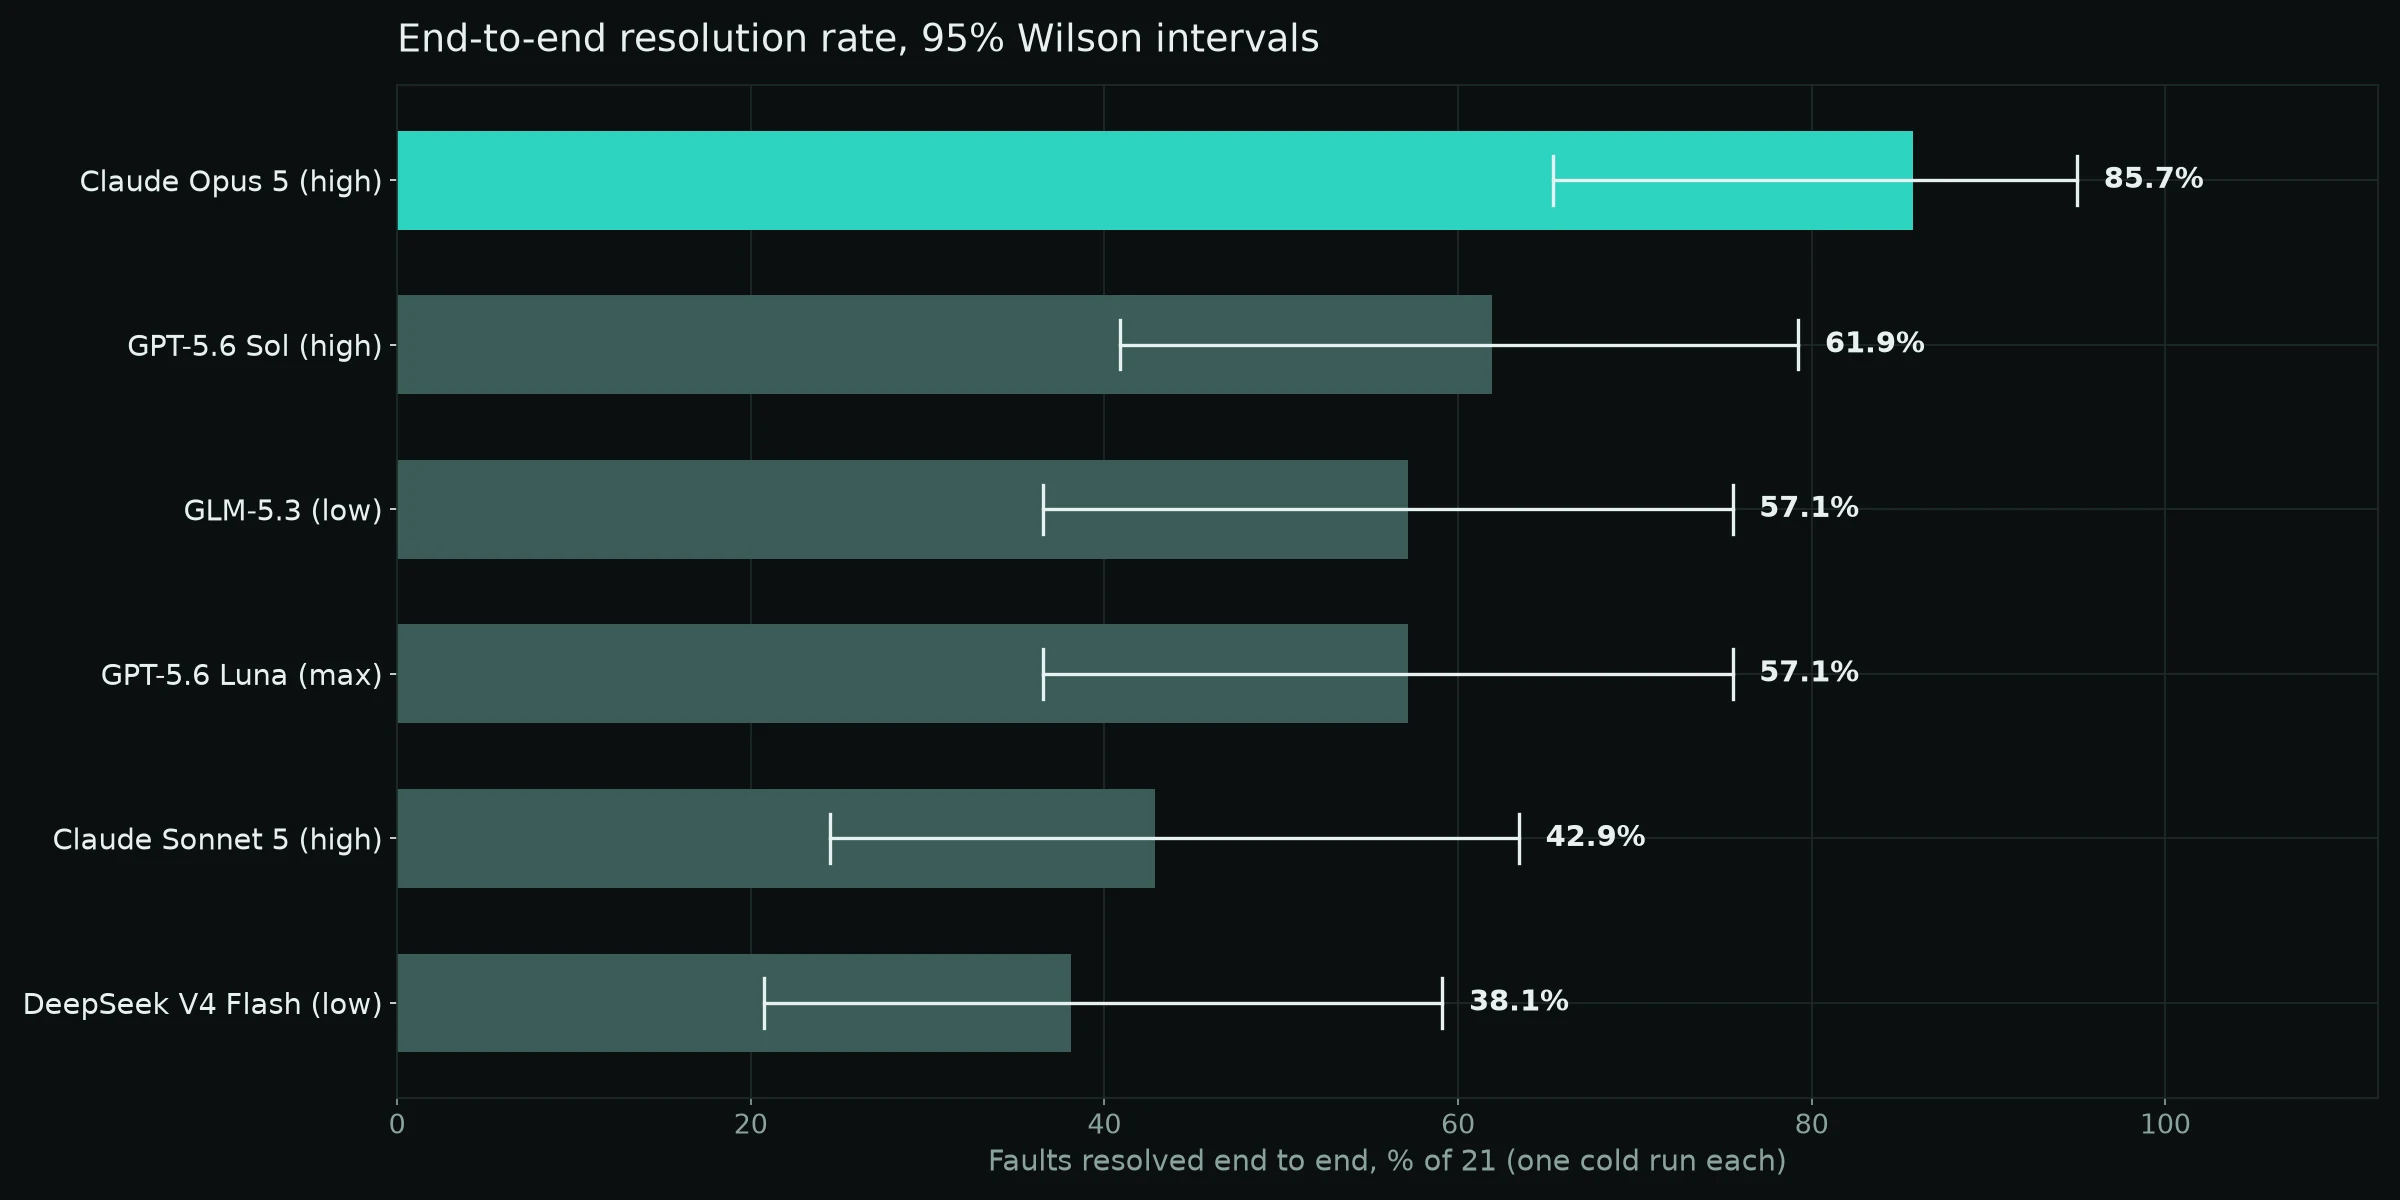
Horizontal bar chart of end-to-end resolution rate for six models inside CloudThinker Resolve, with 95% Wilson confidence intervals. Claude Opus 5 leads at 85.7%. Every interval overlaps its neighbour.
Every confidence interval overlaps its neighbour. With 21 faults and one run each, only two pairwise gaps separate at 95% confidence: Opus 5 against Sonnet 5, and Opus 5 against DeepSeek. Read the table as "Opus 5, then a pack", not as a ranking.
What the second table says that the first cannot
Cost per resolved fault is the number that matters. Cost per fault attempted rewards a model that fails fast. Opus 5 costs $9.53 per resolved fault. Sol costs more per resolution and resolves five fewer faults, so it is both worse and dearer. GLM-5.3 reaches two thirds of the Opus 5 outcome at one sixth of the price, with a fatter latency tail.
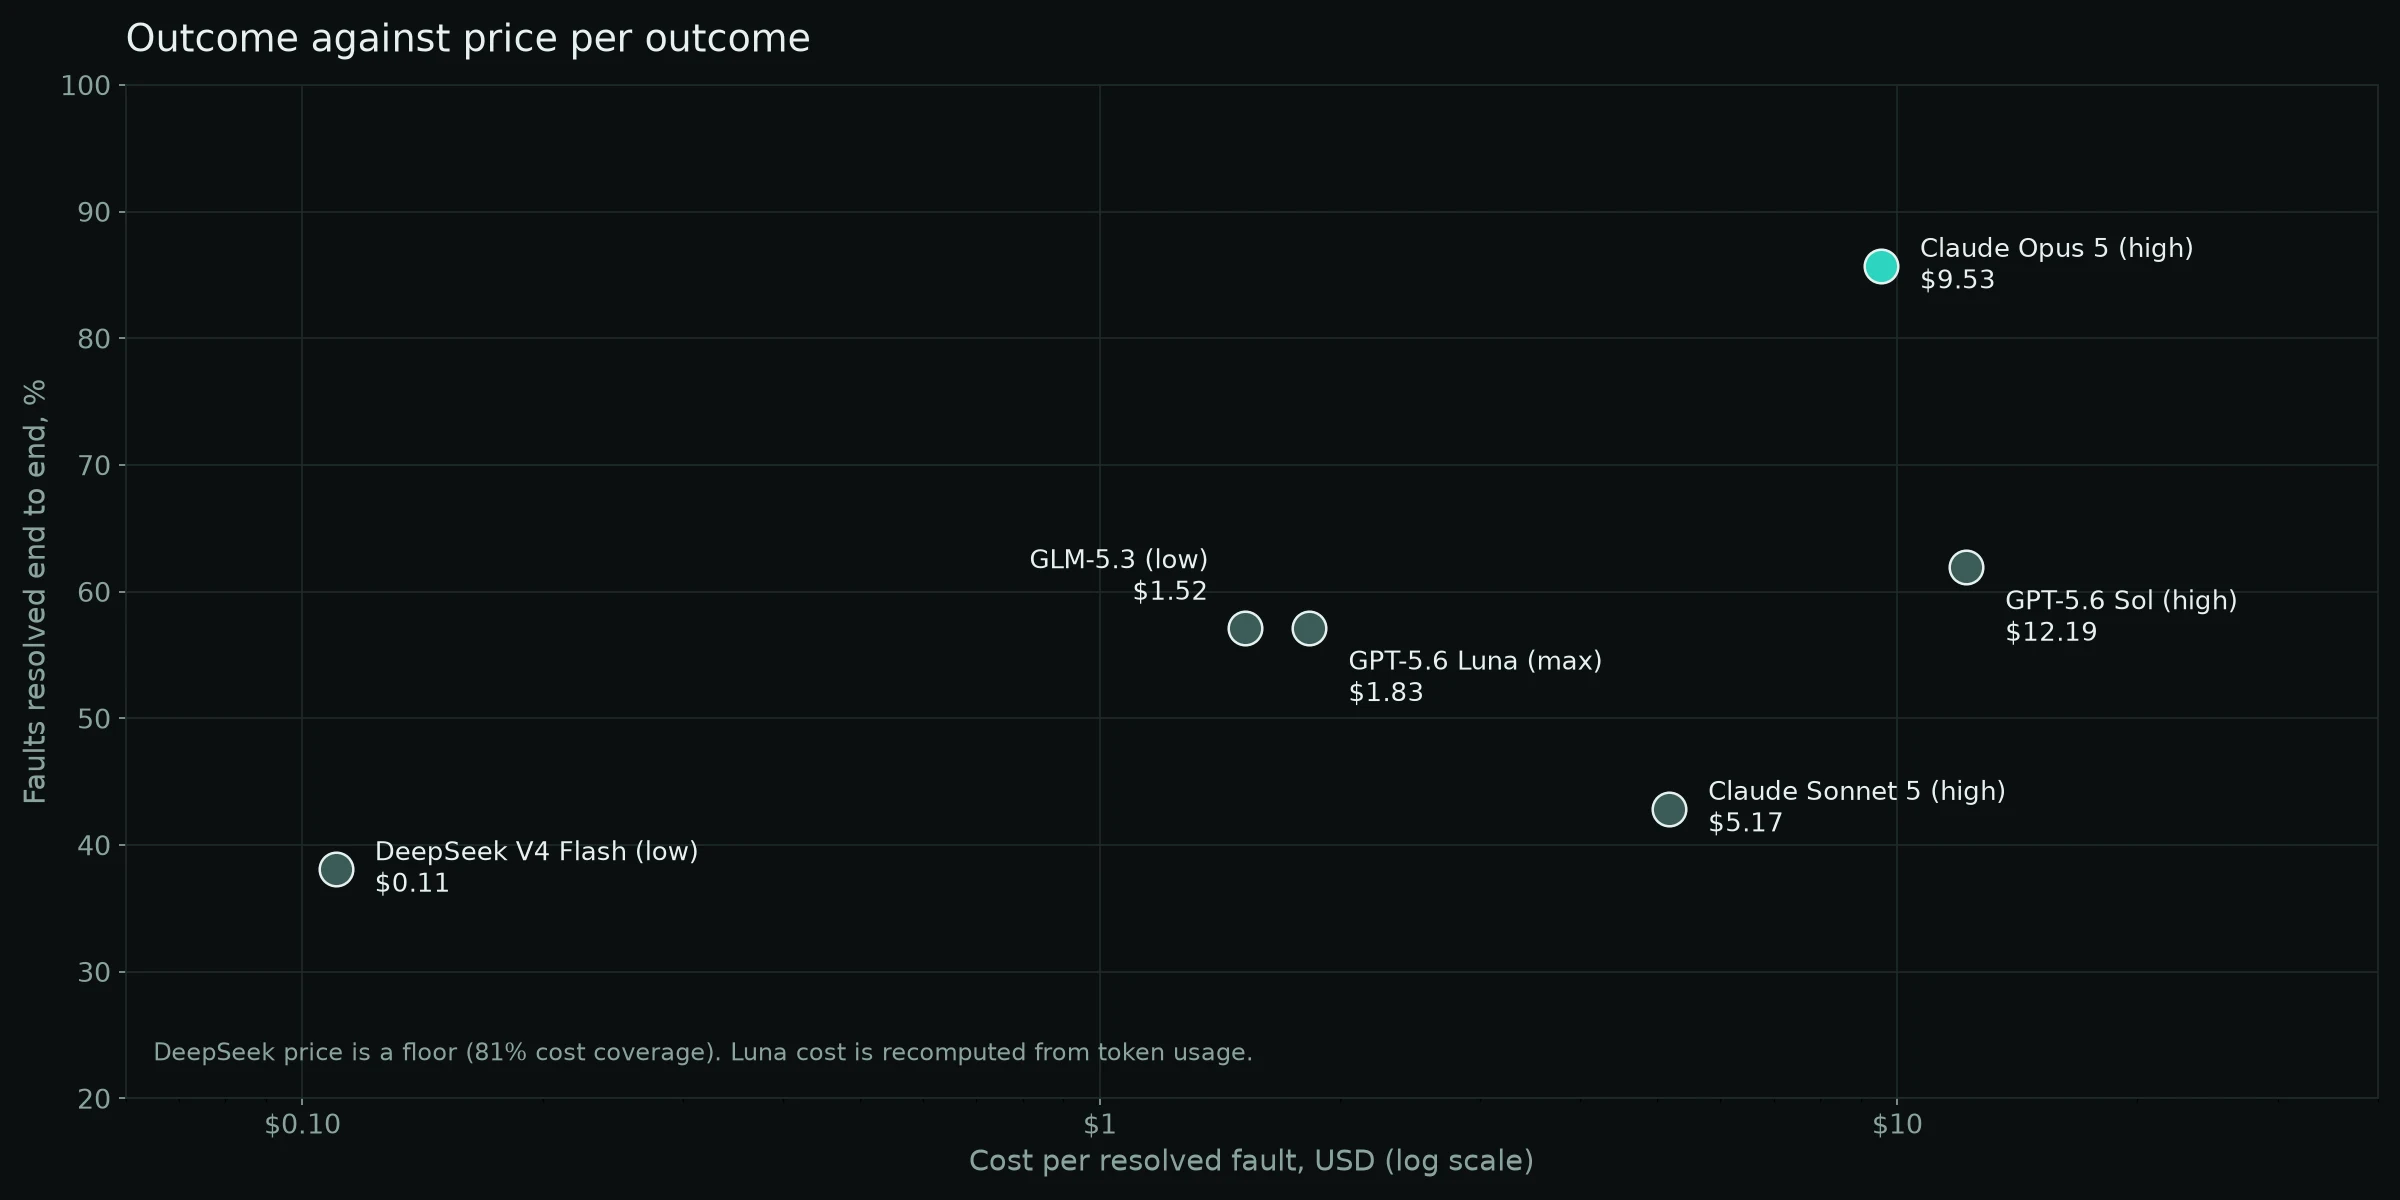
Scatter plot of end-to-end resolution rate against cost per resolved fault on a log scale. Claude Opus 5 sits top right at $9.53 and 85.7%. GLM-5.3 and GPT-5.6 Luna sit in the middle near $1.50 to $2. DeepSeek sits bottom left at $0.11.
Token spend does not predict accuracy. Opus 5 at 1.93M tokens per run and Sol at 1.75M are the two cheapest by tokens and the top two by resolution. Sonnet 5 at 6.22M comes fifth. Sonnet 5 and DeepSeek also spend more tokens on the runs they fail than on the runs they resolve. A model that burns context while losing is lost, not working harder.
Diagnosis and mitigation are separate skills. Luna has the third-best mitigation rate and the fourth-best diagnosis rate. It fixes things it describes wrongly. Six of its 21 runs restored the service while the write-up named the wrong component. That is an operational risk, not a scoring artifact: a human reading that postmortem learns the wrong lesson. Opus 5 had zero such runs.
Failures cluster by fault, not by model. When five models missed the mutating-webhook fault, all five named the same victim pod instead of the webhook that was injecting the bad limits. When four models missed the duplicate-PVC fault, all four wrote that the tracing service was out of scope, because our prompt told them so. The fault type decides how the failure looks. The model decides whether it fails.
What we changed because of this
Opus 5 at high effort is now the default model for Resolve. It leads every stage, it is the only model whose diagnosis and fix stayed coupled on every fault, and it is not the most expensive per outcome.
We are keeping GLM-5.3 at low effort available as a budget tier for teams that want the incident loop at a seventh of the price and can accept a longer tail.
We are fixing our own diagnosis prompt. One fault in 21 is unwinnable for every model because we told the agent to look away from tracing. That is the cheapest point of improvement in the whole study, and it is ours, not the models'.
What we are not claiming
- We are not on the official leaderboard. Acceptance requires full agent transcripts handed to the maintainers. We keep those transcripts and we are talking to the maintainers, but until a row is accepted the comparison above is ours.
- One run per fault. The leaderboard aggregates three. A one-fault margin at the top is not a ranking.
- Our judge is the paper's judge, Claude Sonnet 4.6, but the leaderboard does not say what judged its rows.
- Noise injection was off. If the leaderboard rows ran with noise on, they carried a harder condition than ours.
- Sonnet 5 is understated. Several of its runs were lost to failures in our stack, not to the model. Its true rate is higher by an amount we did not measure.
The full internal report, the per-fault grid for all six models, and the ledger behind every number in this post are available on request.