Connect your stack. Give every agent the full picture.
Secure, read-only connections bring signals from your clouds, observability, code, databases, and collaboration tools into one operational context — so agents can reason before they act.
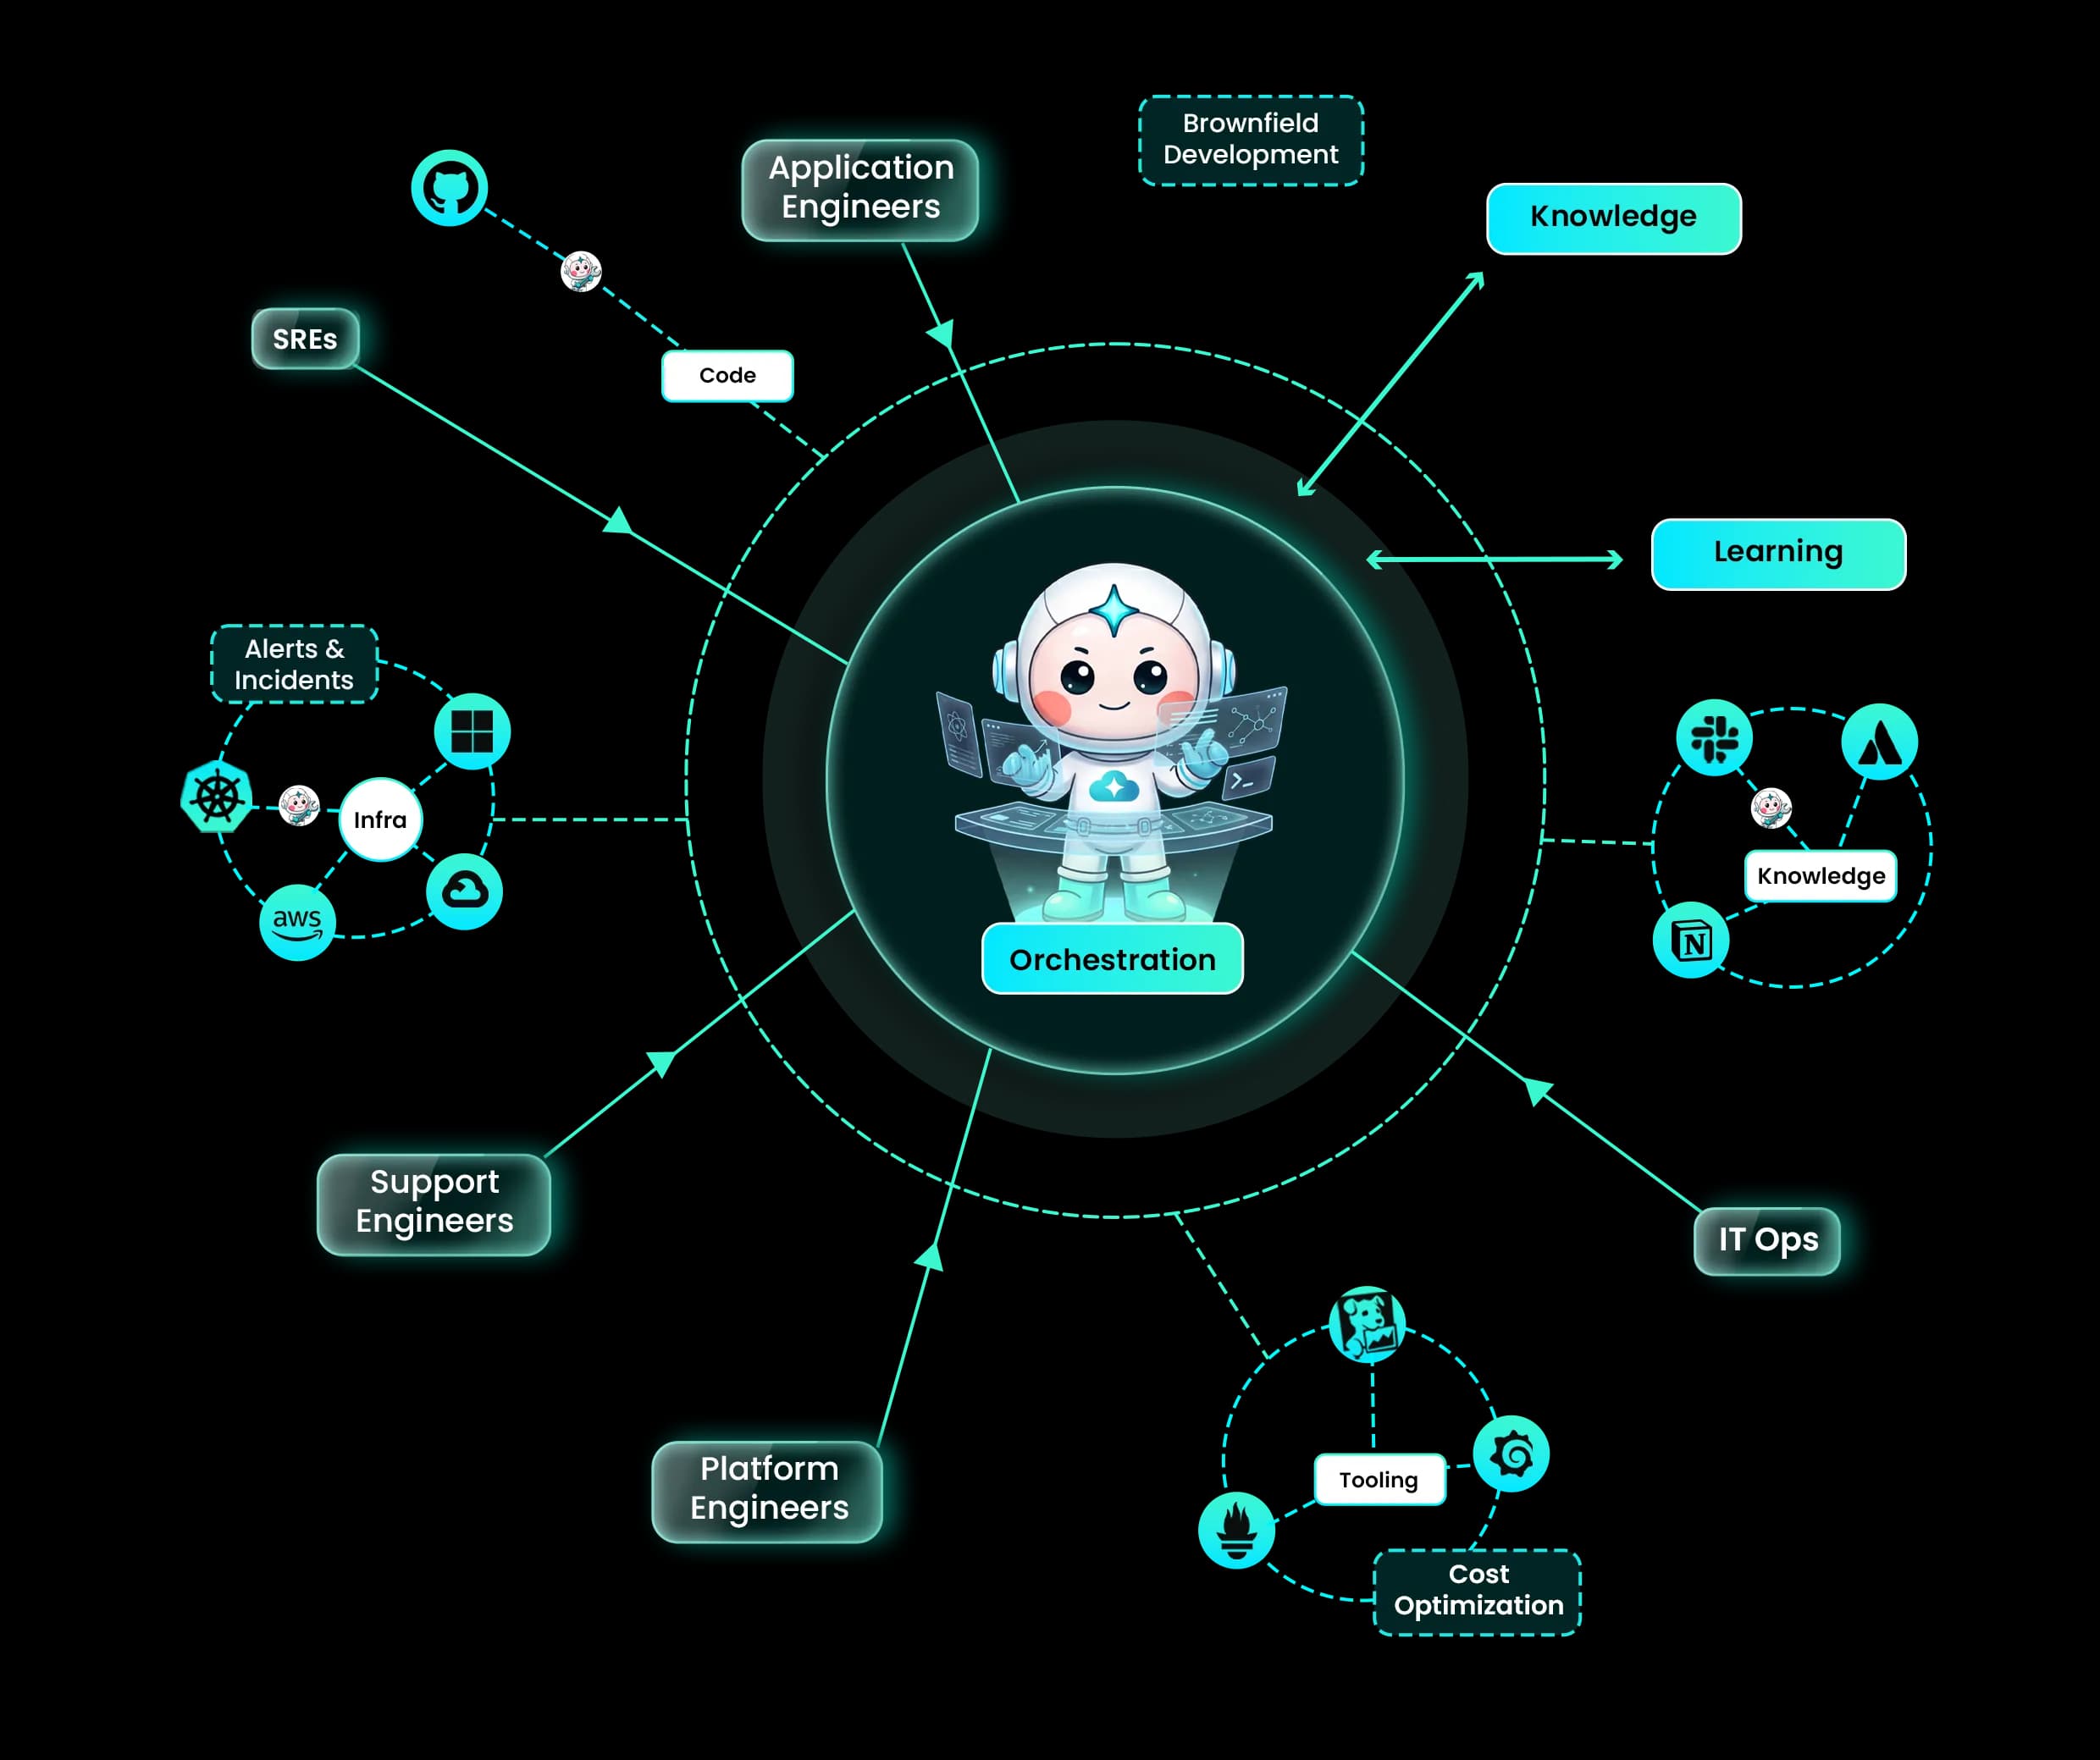
Connect your entire stack in minutes
35+ native connections across cloud, data, observability, and delivery — each with scoped credentials and a step-by-step guide. Click any connection to open its setup docs.
Cloud & Platforms
15
AWS
EC2, RDS, S3, Lambda, EKS, and 100+ services

Google Cloud
Compute Engine, Cloud SQL, GKE, BigQuery

Azure
VMs, SQL Database, AKS, Blob Storage

Vercel
Deployments, projects, and edge network
DigitalOcean
PlannedDroplets, Kubernetes, and managed databases
Oracle Cloud
PlannedOCI compute, database, and networking
IBM Cloud
PlannedCompute, Kubernetes, and managed services
Alibaba Cloud
PlannedECS, RDS, and ACK clusters
Akamai (Linode)
PlannedCompute instances and managed Kubernetes
Netlify
PlannedDeploys, edge functions, and hosting
Heroku
PlannedDynos, add-ons, and pipelines
Fly.io
PlannedApps, machines, and edge deploys
Render
PlannedServices, cron jobs, and databases
VMware vSphere
PlannedVMs, clusters, and on-prem virtualization
OpenStack
PlannedPrivate-cloud compute and networking
Databases & Streaming
26
PostgreSQL
Query analysis, performance tuning, optimization

MySQL
Performance monitoring, slow-query analysis

MongoDB
Cluster health, queries, and index analysis

Redis
Cache performance, memory, keyspace insights

Neon
Serverless Postgres with OAuth-secured access

Apache Kafka
Confluent Cloud with scope-based credentials

RabbitMQ
Queues, exchanges, and message-flow health

Elasticsearch
Log analysis, search operations, observability
DynamoDB
PlannedTables, capacity, and hot-key analysis
Apache Cassandra
PlannedWide-column cluster health and queries
CockroachDB
PlannedDistributed SQL health and performance
ClickHouse
PlannedOLAP query performance and storage
MariaDB
PlannedPerformance monitoring and slow queries
SQL Server
PlannedQuery tuning and health monitoring
Oracle Database
PlannedAWR, query, and instance health
Snowflake
PlannedWarehouse usage, cost, and query profiling
BigQuery
PlannedQuery cost, slots, and performance
Databricks
PlannedLakehouse jobs, clusters, and cost
Amazon Redshift
PlannedCluster performance and query tuning
Supabase
PlannedPostgres, auth, and edge functions
PlanetScale
PlannedServerless MySQL branches and insights
InfluxDB
PlannedTime-series ingestion and queries
OpenSearch
PlannedSearch, log analytics, and cluster health
Apache Pulsar
PlannedTopics, subscriptions, and backlog
NATS
PlannedSubjects, streams, and message flow
Pinecone
PlannedVector index performance and usage
Observability & Monitoring
32
Datadog
Metrics, monitors, logs, and dashboards

Grafana
Dashboards, metrics, and alerting

Prometheus
Metrics, PromQL queries, and alert rules

New Relic
APM, NRQL queries, and alerting

Dynatrace
Problems, metrics, and full-stack traces
AppDynamics
Application performance and business transactions
Zabbix
Hosts, triggers, and infrastructure alerts

Better Stack
Uptime monitoring, incidents, and logs
Coralogix
Logs, metrics, and traces at scale
SigNoz
Open-source APM, traces, and metrics

Rollbar
Error tracking and deploy monitoring
Sentry
PlannedError tracking, traces, and release health
Honeycomb
PlannedHigh-cardinality events and trace exploration
Chronosphere
PlannedMetrics at scale with cost control
Sumo Logic
PlannedLog analytics and cloud SIEM insights
Splunk
PlannedLog search, dashboards, and alerting
Moogsoft
PlannedAIOps alert correlation and noise reduction
OpenTelemetry
PlannedTraces, metrics, and logs pipeline
Grafana Loki
PlannedLog aggregation and LogQL
Grafana Tempo
PlannedDistributed tracing backend
Jaeger
PlannedTrace collection and analysis
Graylog
PlannedCentralized log management
Logz.io
PlannedManaged ELK logs and metrics
VictoriaMetrics
PlannedHigh-scale time-series metrics
Thanos
PlannedLong-term Prometheus storage and query
Nagios
PlannedHost and service monitoring
Netdata
PlannedReal-time per-second metrics
Pingdom
PlannedUptime and page-speed monitoring
UptimeRobot
PlannedUptime checks and alerts
Checkly
PlannedSynthetic and API monitoring
Site24x7
PlannedFull-stack and uptime monitoring
Instana
PlannedAutomatic APM and tracing
Infrastructure & DevOps
37
Kubernetes
EKS, GKE, AKS, and self-managed clusters

Cloudflare
DNS, analytics, and edge configuration

Argo CD
GitOps deployments and sync status

Jenkins
Pipelines, builds, and job health

CircleCI
Pipelines, workflows, and build insights

AWX
Ansible playbooks, jobs, and inventories

SonarQube
Code quality gates and security analysis

Vault
Secrets, tokens, and credential brokering
SSH
Any Linux server over secure shell
Terraform
PlannedIaC plans, state, and drift awareness
Ansible
PlannedPlaybooks, configuration, and provisioning
Spacelift
PlannedIaC orchestration with policy and state
env0
PlannedIaC environments and cost guardrails
Firefly
PlannedCloud asset discovery and drift detection
Backstage
PlannedService catalog, ownership, and templates
GitHub Actions
PlannedWorkflows, runners, and CI/CD
GitLab CI/CD
PlannedPipelines, jobs, and runners
Bitbucket Pipelines
PlannedCI/CD pipelines and deployments
Azure DevOps
PlannedPipelines, boards, and repos
Buildkite
PlannedScalable CI/CD pipelines
Drone CI
PlannedContainer-native pipelines
TeamCity
PlannedBuild pipelines and chains
Harness
PlannedCI/CD and deployment automation
Spinnaker
PlannedMulti-cloud continuous delivery
Octopus Deploy
PlannedRelease and deployment automation
Flux CD
PlannedGitOps continuous delivery
Helm
PlannedKubernetes package and release management
Pulumi
PlannedIaC in real programming languages
Crossplane
PlannedKubernetes-native control planes
Atlantis
PlannedTerraform pull-request automation
Docker
PlannedImages, registries, and containers
HashiCorp Nomad
PlannedWorkload orchestration and scheduling
HashiCorp Consul
PlannedService mesh and discovery
Rancher
PlannedMulti-cluster Kubernetes management
OpenShift
PlannedEnterprise Kubernetes platform
Puppet
PlannedConfiguration management at scale
Chef
PlannedInfrastructure configuration automation
Security & DevSecOps
37Wiz
PlannedCloud risk, misconfigurations, and attack paths
Orca Security
PlannedAgentless cloud workload and data risk
Prisma Cloud
PlannedCode-to-cloud posture and runtime security
Lacework
PlannedBehavioral anomaly and misconfiguration detection
Aqua Security
PlannedContainer image scanning and runtime policy
Sysdig
PlannedRuntime threat detection and CSPM
Snyk
PlannedCode, dependency, container, and IaC scanning
GitGuardian
PlannedSecret detection across repos and pipelines
CrowdStrike
PlannedEndpoint and cloud threat detection
Keycloak
PlannedIdentity, realms, and access policies
Firebase
PlannedSecurity rules, App Check, and auth posture
Trivy
PlannedContainer, IaC, and dependency scanning
Semgrep
PlannedStatic analysis and custom rules
Checkmarx
PlannedSAST and application security testing
Veracode
PlannedSAST, DAST, and SCA
Qualys
PlannedVulnerability management and compliance
Tenable
PlannedNessus vulnerability scanning
Rapid7
PlannedInsightVM and threat detection
Falco
PlannedRuntime threat detection for Kubernetes
Anchore
PlannedContainer image scanning and policy
JFrog Xray
PlannedArtifact and dependency scanning
Mend
PlannedOpen-source and SCA security
Sonatype Nexus
PlannedRepository firewall and SCA
Dependabot
PlannedDependency updates and alerts
Prowler
PlannedCloud security assessments
Kubescape
PlannedKubernetes security posture
OPA / Gatekeeper
PlannedPolicy-as-code enforcement
Kyverno
PlannedKubernetes-native policy management
Checkov
PlannedIaC misconfiguration scanning
SentinelOne
PlannedEndpoint detection and response
Microsoft Defender
PlannedCloud and endpoint security
Okta
PlannedIdentity and single sign-on
Auth0
PlannedAuthentication and authorization
CyberArk
PlannedPrivileged access management
Doppler
PlannedSecrets management and sync
1Password
PlannedSecrets and credential management
Teleport
PlannedZero-trust infrastructure access
Cost & FinOps
18Kubecost
PlannedKubernetes cost by namespace, workload, and team
CloudHealth
PlannedMulti-cloud cost, budgets, and policies
Cloudability
PlannedCost visibility, allocation, and rightsizing
Vantage
PlannedCost reports, alerts, and forecasts
Spot.io
PlannedSpot automation and commitment optimization
ProsperOps
PlannedAutonomous Savings Plans and RI management
nOps
PlannedIdle-resource and commitment optimization
CAST AI
PlannedKubernetes rightsizing and bin-packing
Infracost
PlannedCost estimates in pull requests
OpenCost
PlannedOpen-source Kubernetes cost
Finout
PlannedUnified cloud cost and FinOps
Anodot
PlannedCost anomaly detection
Zesty
PlannedAutomated commitment optimization
Densify
PlannedResource rightsizing and optimization
Harness CCM
PlannedCloud cost management and autostopping
AWS Cost Explorer
PlannedAWS cost analysis and forecasts
Azure Cost Management
PlannedAzure cost and budgets
Ternary
PlannedCloud FinOps and allocation
Incident & Ticketing
21
PagerDuty
On-call schedules, incidents, escalations
ServiceNow
Incidents, changes, and ITSM workflows

Atlassian
Jira and Confluence, kept in the loop
Backlog
Projects, issues, and team collaboration
incident.io
PlannedIncident response, on-call, and status pages
Rootly
PlannedIncident management and automated workflows
FireHydrant
PlannedIncident response and runbook automation
Opsgenie
PlannedAlert routing, on-call, and escalations
BigPanda
PlannedEvent correlation and incident intelligence
Jira Service Management
PlannedITSM incidents, requests, and changes
Zendesk
PlannedSupport tickets and workflows
Freshservice
PlannedITSM and service desk
Linear
PlannedIssue tracking and projects
ClickUp
PlannedTasks, docs, and projects
Asana
PlannedWork and project management
monday.com
PlannedWork OS and project boards
Statuspage
PlannedStatus pages and incident comms
Squadcast
PlannedOn-call and incident response
xMatters
PlannedOn-call and service reliability
Grafana OnCall
PlannedOn-call scheduling and alerts
Zenduty
PlannedIncident and alert management
IoT & Telematics
8Flespi
GPS devices, telemetry, fleet management
AWS IoT Core
PlannedDevice connectivity and telemetry
Azure IoT Hub
PlannedDevice management and messaging
ThingsBoard
PlannedIoT device and telemetry platform
Traccar
PlannedGPS tracking and fleet telemetry
Samsara
PlannedConnected fleet and IoT operations
Geotab
PlannedTelematics and fleet data
Teltonika
PlannedGPS trackers and device data

Don't see your tool? Connect it with MCP
CloudThinker speaks the Model Context Protocol. Point it at any MCP server — internal tools included — and agents use it like a native connection.


Enterprise-grade security at every layer
Authentication
Multiple authentication methods ensure secure access to every connected platform.
Encryption
All data is encrypted in transit and at rest using industry-standard protocols.
Compliance
Built for regulated environments with full auditability and compliance controls.
Approval Gate
Every agent action passes an approval gate — you decide how much autonomy each connection gets.
Ready to connect your stack?
Set up secure connections in minutes and let CloudThinker's AI work across your entire ecosystem.
- 100+ integrations
- New connections in minutes
- Enterprise-grade security