


Frontier Investigationfor Every Alert
Every alert from every monitoring tool investigated to root cause before a human opens it.
Connect the monitoring tools you already run. Agents pick up each alert, pull the logs, metrics, traces and recent changes behind it, and hand your on-call a root cause with the evidence attached. Noise is closed with a written reason. Real issues arrive with a fix ready to approve.
checkout-api p99 latency above 2s
- Signals
- RDS CPU at 94%, 4,210 slow queries, error rate flat
- Change
- Deploy v2.14.0 at 09:12 ran migration 0193
- Root cause
- Migration dropped the index on orders.customer_id
- Evidence
- 6 linked queries, traces and diffs
- Fix
- Recreate the index online. Reversible, no rollback needed
Investigated in 94s. Waiting for on-call approval
[The work behind every alert]
Alerts fire in seconds.Root causes still take hours.
01The manual work
Investigate
An alert is only the start. On-call still opens every dashboard, pulls logs, checks the last deploy and pieces together what went wrong.
02The agent handoff
Root cause ready
Frontier agents take the alert the moment it fires, connect the evidence and prepare a root cause and a fix for your team to review.
03Your engineers’ role
Approve
Set what agents may close on their own. Review the proposed fix and decide what reaches production.
[Where CloudThinker fits]
Your stack stays.Agents work inside it.
01Signal sources
Already in your monitoring
 Amazon CloudWatchAlarms, logs and X-Ray traces
 Azure MonitorAlerts, Log Analytics, Application Insights
 Google Cloud MonitoringAlerting policies and Cloud Logging
 DatadogMonitors, APM and logs
 Prometheus and GrafanaAlertmanager rules and dashboards
No change to your alert rules
02Paging and change
Your system of record
 PagerDutyIncidents and escalation policy
- OpsgenieAlert routing and schedules
 GitHub and GitLabDeploys, diffs and pipelines
 Argo CDKubernetes rollouts and history
Source of truth stays put
03Investigation
 CloudThinker
- CorrelateLogs, metrics and traces in one timeline
- Trace the changeThe deploy, config or infra edit behind it
- ProveEach finding linked to its query, trace or diff
- ProposeA reversible fix at your approval level
Read-only by default
04Response
Fixes, not pages
 SlackRoot cause posted to the incident channel
 Microsoft TeamsApprove the fix from the thread
- JiraFollow-up ticket with the evidence
- PagerDutyIncident resolved once the fix is verified
Fix runs on approval
[Example scenario]
Tuesday, 02:14. Checkout slows down.Your on-call is still asleep.
A 40-engineer e-commerce team on EKS and RDS, with CloudWatch, Datadog and PagerDuty. One engineer on call, a sale starting at 08:00.
- 02:14
Alarm firesSignal
CloudWatch: checkout-api p99 latency above 2s for 5 minutes. PagerDuty opens an incident.
- 02:14
Agent picks it upAgent
Groups 3 related alerts, pulls RDS metrics, slow query logs, traces and the last 24 hours of deploys.
- 02:15
Root cause, with proofAgent
Deploy v2.14.0 ran migration 0193, which dropped the index on orders.customer_id. Linked: the diff, the query plan, the trace.
- 02:16
Fix proposedAgent
Recreate the index online. Reversible, no rollback of the release needed. Posted to the incident channel and paged on-call.
- 02:21
On-call approves from bedYour team
Reads the evidence on a phone, taps Approve. The agent runs the change under the on-call’s approval.
- 02:29
Verified and written upAgent
p99 back under 300ms. Incident resolved, postmortem draft and a ticket to add a migration check left for the morning.
PagerDuty02:14
Triggered: checkout-api p99 latency above 2s (CloudWatch).
CloudThinker02:16
Root cause: migration 0193 in deploy v2.14.0 dropped idx_orders_customer_id. 4,210 slow queries since 02:09. Proposed fix: CREATE INDEX CONCURRENTLY. Reversible. Evidence: 6 links.
On-call SRE02:21
Checked the query plan. Approved.
CloudThinker02:29
Index rebuilt. p99 at 280ms and steady for 5 minutes. Incident resolved. Postmortem draft and follow-up ticket CHK-1182 created.
- from alarm to approved fix
- 7 min
- dashboards opened by a person
- 0
- from the on-call engineer
- 1 tap
An illustrative example. Team, systems and times are representative, not a specific customer.
[Frontier investigation agents]
Every alert gets a first look.Only the real ones reach a person.
Agents work every alert source on the same policy, so a page at 3am arrives already investigated, and a noisy rule gets flagged instead of muted.
- Correlate every signal
- Logs, metrics, traces and related alerts pulled into one timeline, across every tool the alert touches.
- Trace it to a change
- Deploys, config edits and infrastructure changes lined up against the moment things went wrong.
- Close the noise
- Noisy alerts closed with a written reason and the evidence behind it. Repeat offenders flagged for tuning.
- Hand over a fix
- Real issues come with a reversible fix that runs only at the approval level you set.
[What changes]
Same team. Same tools.Far less of the work by hand.
| Moment | Today | With frontier agents |
|---|---|---|
| First look at an alert | Whenever on-call gets to it | Seconds after it fires |
| Gathering context | By hand, tab by tab | Logs, metrics, traces and changes pulled automatically |
| Noisy alerts | Muted or ignored | Closed with a written, auditable reason |
| Handover | A long Slack thread | One root cause report with evidence links |
| What the team learns | Stays in a few senior heads | Captured in every investigation |
[Integrations]
Connects to the rest of your stack.Read-only to start.
- Amazon CloudWatch
- Datadog
- Grafana
- Prometheus
- New Relic
- Dynatrace
- Splunk
- Sentry
- PagerDuty
- Opsgenie
- incident.io
- ServiceNow
- Slack
- GitHub
- GitLab
[Adoption path]
One pilot.Then company-wide.
The rollout follows the four phases of the AWS Cloud Adoption Framework, so it fits the plan your cloud team already runs.
01Envision
Pick one noisy service
Connect one alert source read-only and let agents investigate in shadow mode. Compare their root causes with your team’s.
02Align
Agree the autonomy policy
Decide which alerts agents may close alone, which fixes need approval, and who approves.
03Launch
Roll out team by team
Add each team’s alert sources on the same policies, report format and audit trail.
04Scale
Make it the default
New services launch with investigation on. Findings feed postmortems, runbooks and alert tuning.
[Customer proof]
F88.Results on the record.
A Vietnamese consumer-finance company with 800+ branches grew a small read-only pilot into a governed hybrid-cloud operating model.
- of daily operations automated
- 80%
- lower AWS spend
- 30%
[AWS guidance]
Built the way AWS says to run it.Reviews start from a known reference.
- Operationalizing agentic AI on AWSAWS Prescriptive Guidance on governance, guardrails and lifecycle for agents in production.
- Well-Architected: Operational ExcellenceRespond to events with runbooks, learn from each one, and automate the response.
- AWS Observability Best PracticesCollect and correlate logs, metrics and traces so an investigation has the signals it needs.
[Trust and control]
Agents do the work.Your team keeps control.
- You approve every change
- Agents propose. Nothing touches production until someone on your team says yes, and you set that rule per system.
- Every action on the record
- Each step is logged, attributed and reversible, ready for your auditors.
- Certified for enterprise
- SOC 2 Type II and ISO 42001, with reports in our trust center.
- Runs where you need it
- In our cloud, through AWS Marketplace, or inside your own account.
[Questions]
What teams askbefore they start.
- Does this replace our monitoring tools?
- No. Agents read from the tools you already run, such as CloudWatch, Datadog, Grafana and PagerDuty. Your alert rules and dashboards stay where they are.
- What access does it need?
- Read-only access to the alert sources, observability data and repositories you choose. Access is scoped per source and you can revoke it at any time.
- Can agents act without a person?
- Only where your policy allows it. Most teams start with agents investigating and proposing, then let them close noise and run low-risk fixes once the results have earned trust.
- How does it handle noisy alerts?
- Each noisy alert is closed with a written reason and the evidence behind it. Repeat offenders are flagged so your team can tune or delete the rule.
[Go deeper]
Related reading.Pick the next queue.
- Free Risk InvestigationWe root-cause one real incident from your stack, free.
- Deep Response EngineThe engine that correlates signals into one root cause.
- AI incident responseHow agents change the incident lifecycle end to end.
- What is event intelligence?Grouping and enriching alerts before anyone is paged.
Put an agent on every alert.Keep your engineers for the real ones.
Start with one noisy service, read-only. See the root causes agents find before you grant a single permission more.

Up to $200K in AWS credits
Applied to your own AWS account.
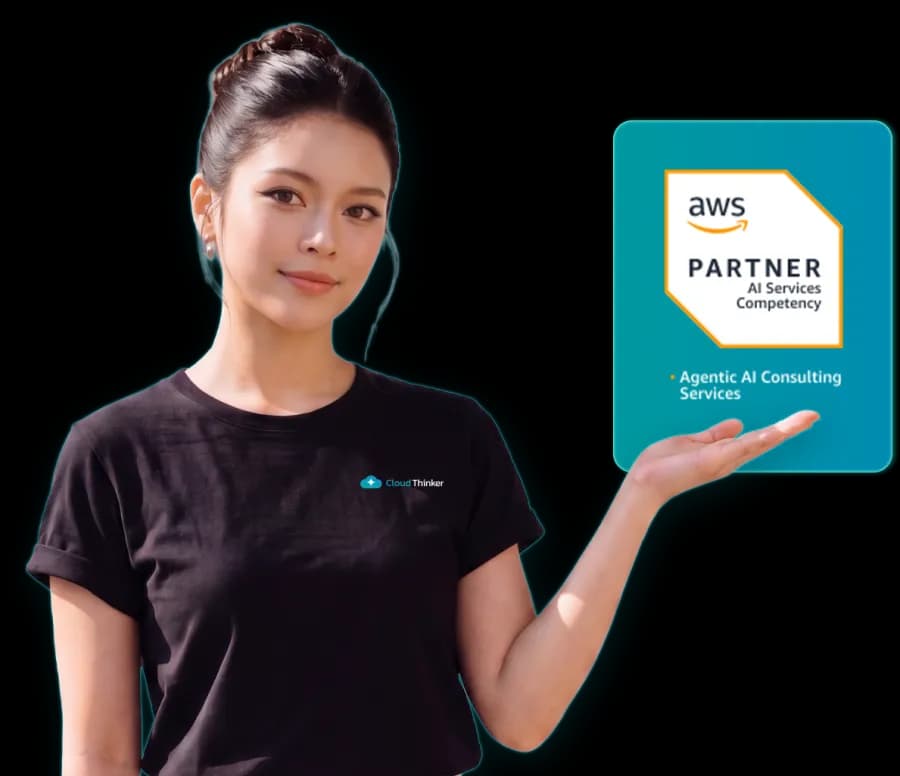
AWS AI Services Competency
Validated for Agentic AI Consulting.
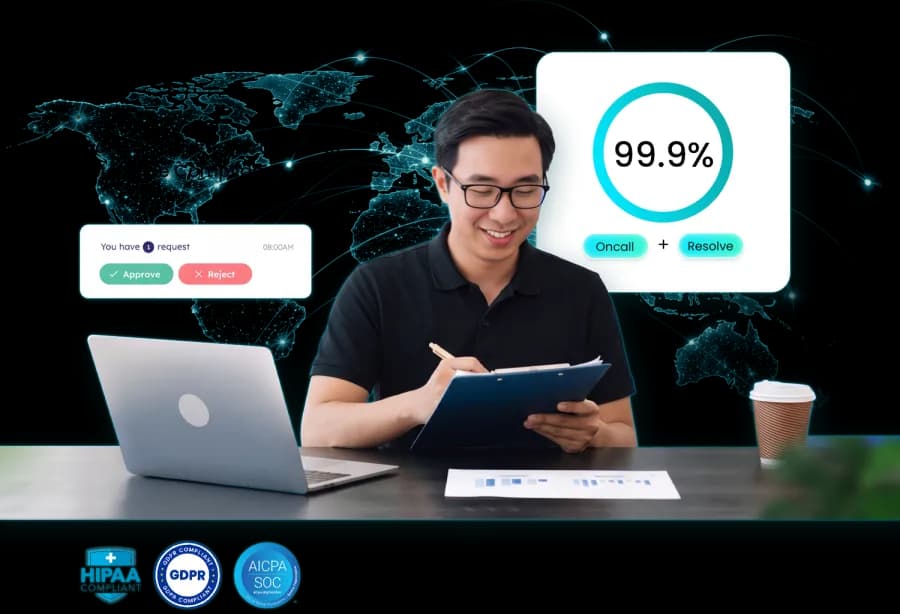
Covered 24/7, on your approval
Under HIPAA, GDPR and SOC 2 controls.