How to Use CloudThinker for Incidents: Three Ways, One Night
Three problems in one night, and three different shapes.
The first had a fix the team had applied many times before. The second had never happened. The third never became a page at all, because the engineer who was still awake asked a question and got an answer.
Resolve handles all three, but it doesn't handle them the same way, and each path needs different setup. Know which path each kind of trouble takes before you wire anything up.
01Seen before
The fix is staged
Memory and your runbook point at a known fix. You approve it.
02Never seen, wide impact
A room opens
Responders and CloudThinker work the incident in one thread.
03Not worth a page
You open a chat
Ask what changed, weigh the options, decide.
The incidents below are illustrative composites. The screens and settings are real.
Where the pages come from
Paths one and two start the same way. Raw events arrive, most get dropped, the survivors are grouped, and only an actionable cluster becomes an incident. Path three skips this, because it starts with a question in chat.
01Ingest
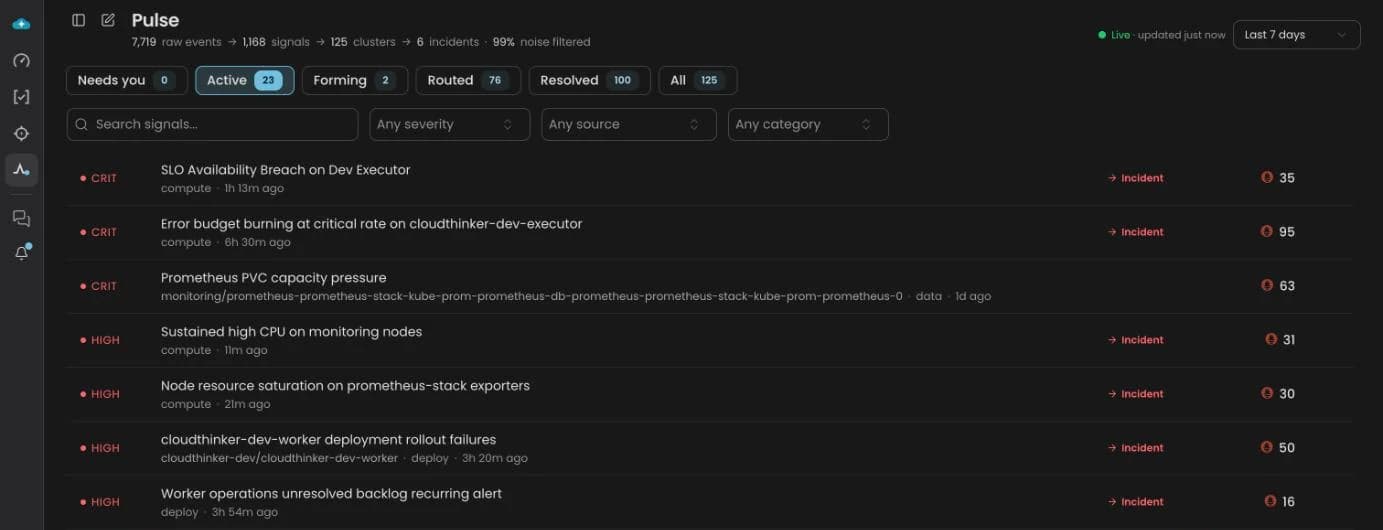
7,719 events
Every alert the connected tools sent over seven days.
02Suppress
1,168 signals
Dedup, rate limit, snoozes and learned noise drop the rest.
03Group
125 clusters
Signals on the same resource, title or service join one cluster.
04Triage
6 incidents
Only a cluster with an actionable signal becomes an incident.
Pulse, the detection layer, runs four checks on every raw event: dedup, a rate limit, snoozes, and noise patterns CloudThinker learned while investigating. Critical and high events always get past the rate limit and the learned-noise check. What survives is a signal, and related signals join one cluster. Here's the same funnel in the product:
Path one: the fix is already known
02:14. A disk alarm fires on a log node. /var/log is at 96% and climbing about 2 GB an hour.
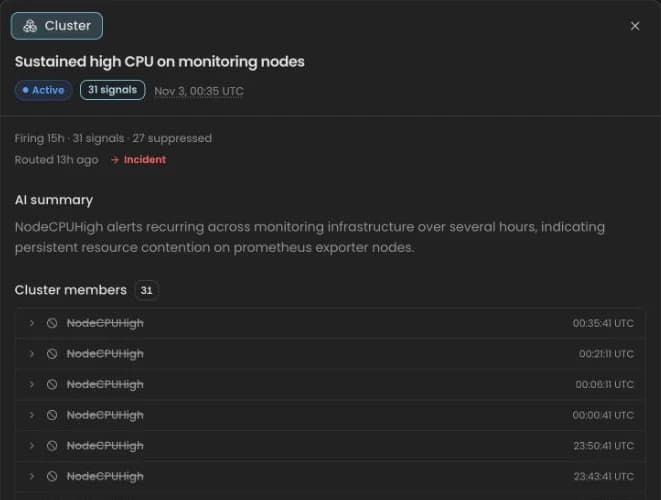
Two related alarms arrive in the next twenty seconds and join the same cluster. One cluster, one incident, one page instead of three.
On duty is on, so the investigation starts without anyone clicking. Before it forms a hypothesis, CloudThinker reads incident memory and finds a recollection with the same symptom on the same node group: logrotate stuck on a locked file. It treats that as a lead, not evidence, and checks the current state. The rotation job failed on a locked file just before midnight, and 38 GB of rotated logs were never compressed or shipped. The verdict comes back Verified, and the team's runbook in Confluence supplies the fix: ship the logs to object storage, compress, restart the rotation job. No application data touched.
The fix is a change, so it goes through Auto Mode, and here it waits for a person. The approval request reaches the on-call engineer's phone. The card shows the command and the reasoning behind it. They approve, and four minutes later the disk is at 31% and the alarm has cleared.
Nobody opened a laptop.
How to set it up
1. Get the events in. Open Resolve → Integrations, pick the platform that owns the alarm, and click Add signal. For most tools that opens a webhook with the field mapping filled in. Check two fields yourself. Map Resource ID Path so repeats of one fault group even when their titles vary. Map Service Path to a value that names one service, such as checkout-api. A broad value like prod joins unrelated faults into one cluster.
Then fire a test alert. A successful HTTP response only proves delivery. Confirm the alert appears on Resolve → Pulse and joins the cluster you expected.
2. Point it at your runbooks. Open Resolve → Runbooks and add a source: a Confluence space, a GitHub or GitLab repository, or up to 20 Markdown files of 5 MB each. Connected sources stay where they are, and CloudThinker reads them at investigation time, so an edit in Confluence counts on the next incident. Title each runbook the way the alert reads (# log node disk full, logrotate stuck, not # Procedure 7), because the title and first lines are what the search matches. The sidebar marks Runbooks Legacy. It still works, and your procedures stay in your own wiki or repo either way.
3. Decide what may run without you. Read-only commands such as kubectl get or df -h run during the investigation without waiting. Every change goes through Auto Mode, so you decide what runs on its own and what waits for approval. You set that on the Approvals page in workspace settings. Rules decide first: each one lets one kind of write run, asks a person first, or refuses it. The approval mode covers any write no Rule matches. The connection's credential sets the ceiling: start with a read-only role, and widen it per connection once you trust what you see.
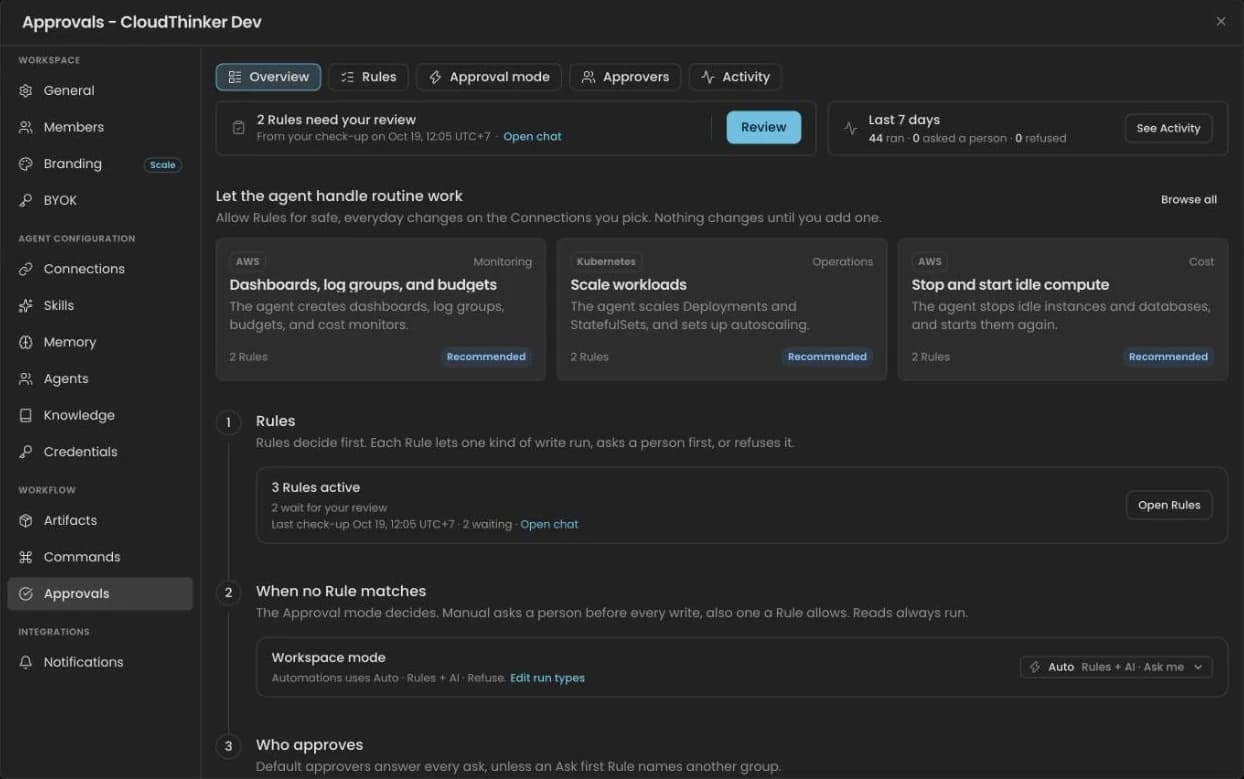
Set this in daylight, once, with the people who own the risk in the room. It decides how much of 02:14 happens without you.
4. Leave On duty on, and make sure an approval can find a person. The On duty switch sits in the header of Resolve → Investigation. It's on in a new workspace, so actionable clusters go to triage and investigation on their own. Pause it while you tune your first noisy source, then turn it back on. There's no timer, so check it after every maintenance window. Per webhook, Auto-investigate and Only from a minimum severity narrow what starts on its own.
Then name who answers at 2 a.m. Add them to Default approvers on the Approvers tab under Approvals, and turn on Agent approvals in Notifications so the request reaches them by email or chat.
Not every incident reaches every stage. An investigation can end with Cause unproven, or with no verdict at all (Not Found), and a runbook might not match. When that happens, you're in path two.
Path two: nobody has seen this before
03:40. Checkout starts returning 502s. Nothing shipped tonight, and nothing in the runbooks or in memory matches.
Triage marks it a page. Resolve opens an Incident Room inside CloudThinker and a Slack war room for the incident, and brings in the responders. The incident lead asks the first question worth asking:
@CloudThinker what changed in the last six hours, anywhere?
The answer lists three candidates: a firewall rule, a database minor-version upgrade and a certificate rotation. The next question narrows it. The 5xx errors start in the same minute as the certificate rotation, and the other two changes leave the error rate flat. The third question confirms it: the new leaf certificate is served without its intermediate, the payment gateway fails the handshake, and the previous certificate is still available. A rollback is ready and waiting for approval.
The lead approves it and asks for a draft of the customer status update. Every judgment call stayed with a person. CloudThinker did the fetching and the correlating.
The investigation also writes itself up as it goes. The incident page leads with the verdict and its evidence label:
Current assessment                                    Verified
The 03:31 certificate rotation on checkout-gw served the leaf
certificate without its intermediate. The payment gateway failed
the TLS handshake, and checkout returned 502.

Remediation
High    Restore the previous certificate on checkout-gw
Medium  Add a chain-completeness check to the rotation job
Below it sit a causal graph of how the failure unfolded, a timeline of every explanation tested and ruled out, and the affected services. Verified means the cause was confirmed against data from your systems. Inferred means it was reasoned from the evidence, so read the timeline before you act. Cause unproven is a lead, not an answer. Resolve: an incident from first alert to postmortem follows one investigation like this through every stage.
How to set it up
The room is a channel you already have. Nothing new to learn.
1. Connect Slack. In Resolve → Integrations, select Slack and click Connect. You need the organization Owner or Admin role, and if your Slack workspace uses app approval, a Slack Workspace Owner has to approve CloudThinker too. Right after connecting, pick a channel for Post incident updates. It's on by default, so the platform shows Needs setup until you do.
2. Check every channel mapping. Each Slack channel maps to one CloudThinker workspace, and that decides which connections a message runs against. An unmapped channel still runs requests, in the organization Owner's default workspace. Check the mapping after every invite, and remove the bot from channels that shouldn't reach production.
3. Turn on On-call and war rooms. In Resolve → On-call, turn on Enable On-call (it's off in a new workspace) and add responders. Then, on the Slack integration, turn on Create war-room channels and pick the floor: Critical only, High & critical (the default) or All severities. The Slack invite list is separate from the On-call responders, so add the same people to both.
4. Talk in the room. Mention @CloudThinker and ask in plain language. Fixes still go through Auto Mode, so talking in the room doesn't skip your policy. In Slack and Teams, an approval card links back to the web app. In Google Chat you can approve on the card itself.
5. Decide where the postmortem goes. Turn on Publish postmortems for Confluence or Notion, and Resolve publishes one after the incident is resolved. It skips false alarms and incidents with no evidence to investigate. Resolve doesn't archive the war room, so archive the channel in Slack when the team is done.
Path three: this one never becomes a page
05:50. Latency on one API goes from 180 ms to 2 s. The checkout incident is closed and the on-call engineer is still at the laptop. It's annoying, not urgent, and nobody wants to page a team before dawn over it.
So nobody does. The engineer opens a chat and asks what changed.
The answer comes back with the deploy log already read, nothing pasted in. A release another team shipped twenty minutes earlier added a synchronous call to another service, whose connection pool is saturated. Nothing else in that path changed.
Asking for options produces three, with the trade-offs attached. Roll back: two minutes, low risk. Raise the pool: quick, but it moves the saturation one hop downstream. Make the call asynchronous: the right fix, and it needs a pull request. The recommendation is the first now and the third this week.
The engineer takes the rollback and asks for a Jira ticket for the third option. Five minutes later latency is back to normal, and the ticket holds the trace and the proposal.
One engineer, five minutes, no page, no room.
How to set it up
Almost nothing, because this path runs on what you already connected.
1. Connections are the setup. CloudThinker knows your deploy history, metrics and pool settings because those systems are connected. For AWS, it assumes an IAM role you create, locked to an External ID, and gets short-lived STS credentials. Start every connection with a read-only credential. Its permissions are the ceiling.
2. Let Auto Mode hold the line. Reads always run. The rollback is a write, so it goes through Auto Mode like every change in the other two paths.
3. Connect where the follow-up lands. Connect Jira, Linear or your git host, so the ticket or a draft merge request comes out of the same chat. Resolve's Propose fix merge requests outcome opens drafts only, and your branch protection still applies.
Choosing between them
| Path one: seen before | Path two: never seen | Path three: not a page | |
|---|---|---|---|
| Starts from | An actionable cluster, with On duty on | A page-level incident | An engineer's question in chat |
| Where it happens | The approval card | The Incident Room and the Slack war room | Any chat |
| What CloudThinker does | Recalls memory, checks it, stages the fix | Answers the room from the running investigation | Reads the change history, lays out options |
| What a person does | Approves the fix | Leads, confirms the cause, approves | Picks the option |
| What you configure | Signals, Runbooks, On duty, approvers | Slack, channel mapping, On-call, war rooms | Connections, Jira or git |
Three things hold on every path. Every change goes through Auto Mode. The work happens where your team already talks: Slack, Teams, Google Chat or the CloudThinker web app. And each incident makes the next one cheaper. CloudThinker writes incident memory (a recollection of each investigated incident, observations, and lessons backed by at least two incidents) and reads it at the start of the next investigation, as leads and never as proof.
Your first week
- Connect one monitoring source and fire a test alert. Confirm it appears on Resolve → Pulse, not only that the webhook returned 200.
- Map Resource ID Path and Service Path so repeats group and memory can match a new alert to an old incident.
- Point Runbooks at wherever your procedures already live. Don't rewrite them first.
- Connect your cloud accounts and clusters with read-only credentials.
- Add approvers and turn on Agent approvals notifications.
- Connect Slack, check every channel mapping, and turn on war rooms at Critical only. Lower the floor once the rooms earn their place.
Then wait for a real page. The first one will tell you more than a week of configuration.
Getting started
While you wait, try these in chat, in the plain language the room uses:
"What changed in the last six hours, anywhere? List deploys, config changes and certificate rotations with timestamps."
"Latency on the orders API doubled after lunch. What's the most likely cause, and what are my options with their trade-offs? Propose only, change nothing."
"Show me last week's incidents where the verdict was Inferred or Cause unproven, and what access would have let you verify them."
Connect a source and ask your first question in Resolve.