
Introducing CloudThinker Incidents
Agentic incident management that thinks like your best engineer.
The 3 AM Problem
It's 3 AM. Your phone buzzes. Another alert: "Database connection timeout."
You stumble to your laptop, eyes half-open, and begin the ritual every on-call engineer knows too well:
- Open a dozen browser tabs
- Jump between monitoring dashboards
- Dig through endless log streams
- Trace the request path across services
- Correlate timestamps manually
- Hope you find the needle in the haystack
By the time you identify the root cause—a misconfigured connection pool after last week's deployment—45 minutes have passed. Your users felt every second of it.
Meanwhile, three more alerts fired for the same issue. Your inbox is chaos. Tomorrow's post-mortem meeting looms.
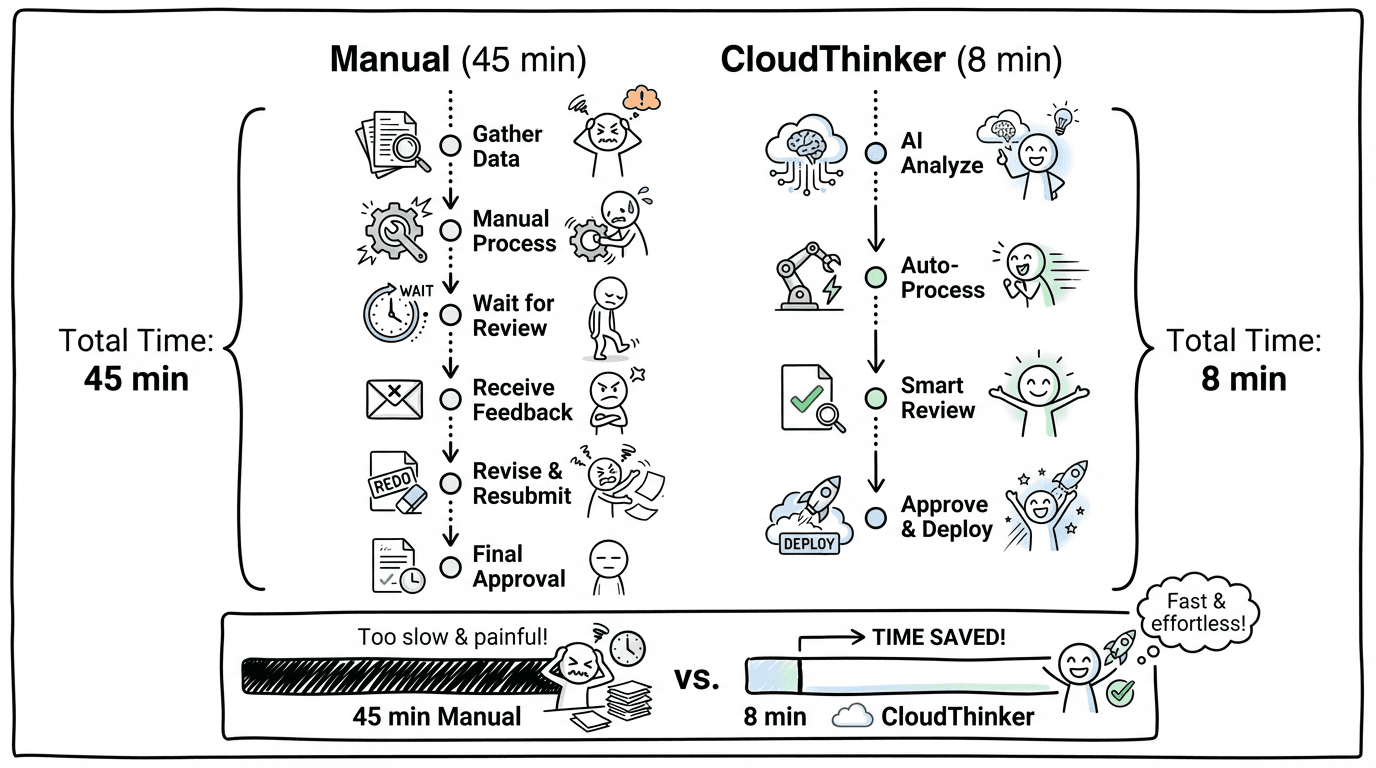
Timeline comparison showing manual incident response taking 45 minutes versus CloudThinker's agentic approach completing in 8 minutes
The tools got prettier. The dashboards got fancier. But the model never changed: humans do all the thinking while tools just display data.
What if that equation flipped?
A New Approach: Agentic Incident Management
CloudThinker Incidents isn't another alerting dashboard or log aggregator. It's an agentic incident platform built on a simple premise:
Your incident management system should think.
Not just collect data. Not just display charts. Actually investigate—forming hypotheses, gathering evidence, and identifying root causes while you focus on resolution.
We built CloudThinker Incidents on four foundational pillars:
- Agentic Root Cause Analysis — AI that investigates like your best engineer
- Topology-Aware Intelligence — Understanding your system as a connected graph
- Seamless Integrations — Connecting to your existing monitoring stack bidirectionally
- Continuous Learning — Getting smarter with every incident you resolve
Let's explore each one.
1. Agentic Root Cause Analysis
Traditional incident tools give you dashboards and expect you to connect the dots. CloudThinker gives you an AI investigator that does the detective work. Our agent doesn't just collect data—it reasons about your system, forming hypotheses, testing them against evidence, ruling out false leads, and converging on the root cause with a confidence score you can trust.

CloudThinker Incident Investigation Dashboard showing root cause analysis with 88% confidence score, remediation suggestions, and live context
When an incident triggers, the AI agent activates and begins a structured investigation. It automatically gathers relevant signals across your infrastructure—metric anomalies with before/after deviation analysis, log entries with deep links to source, distributed traces showing request paths, recent configuration changes, and deployment events in the time window.
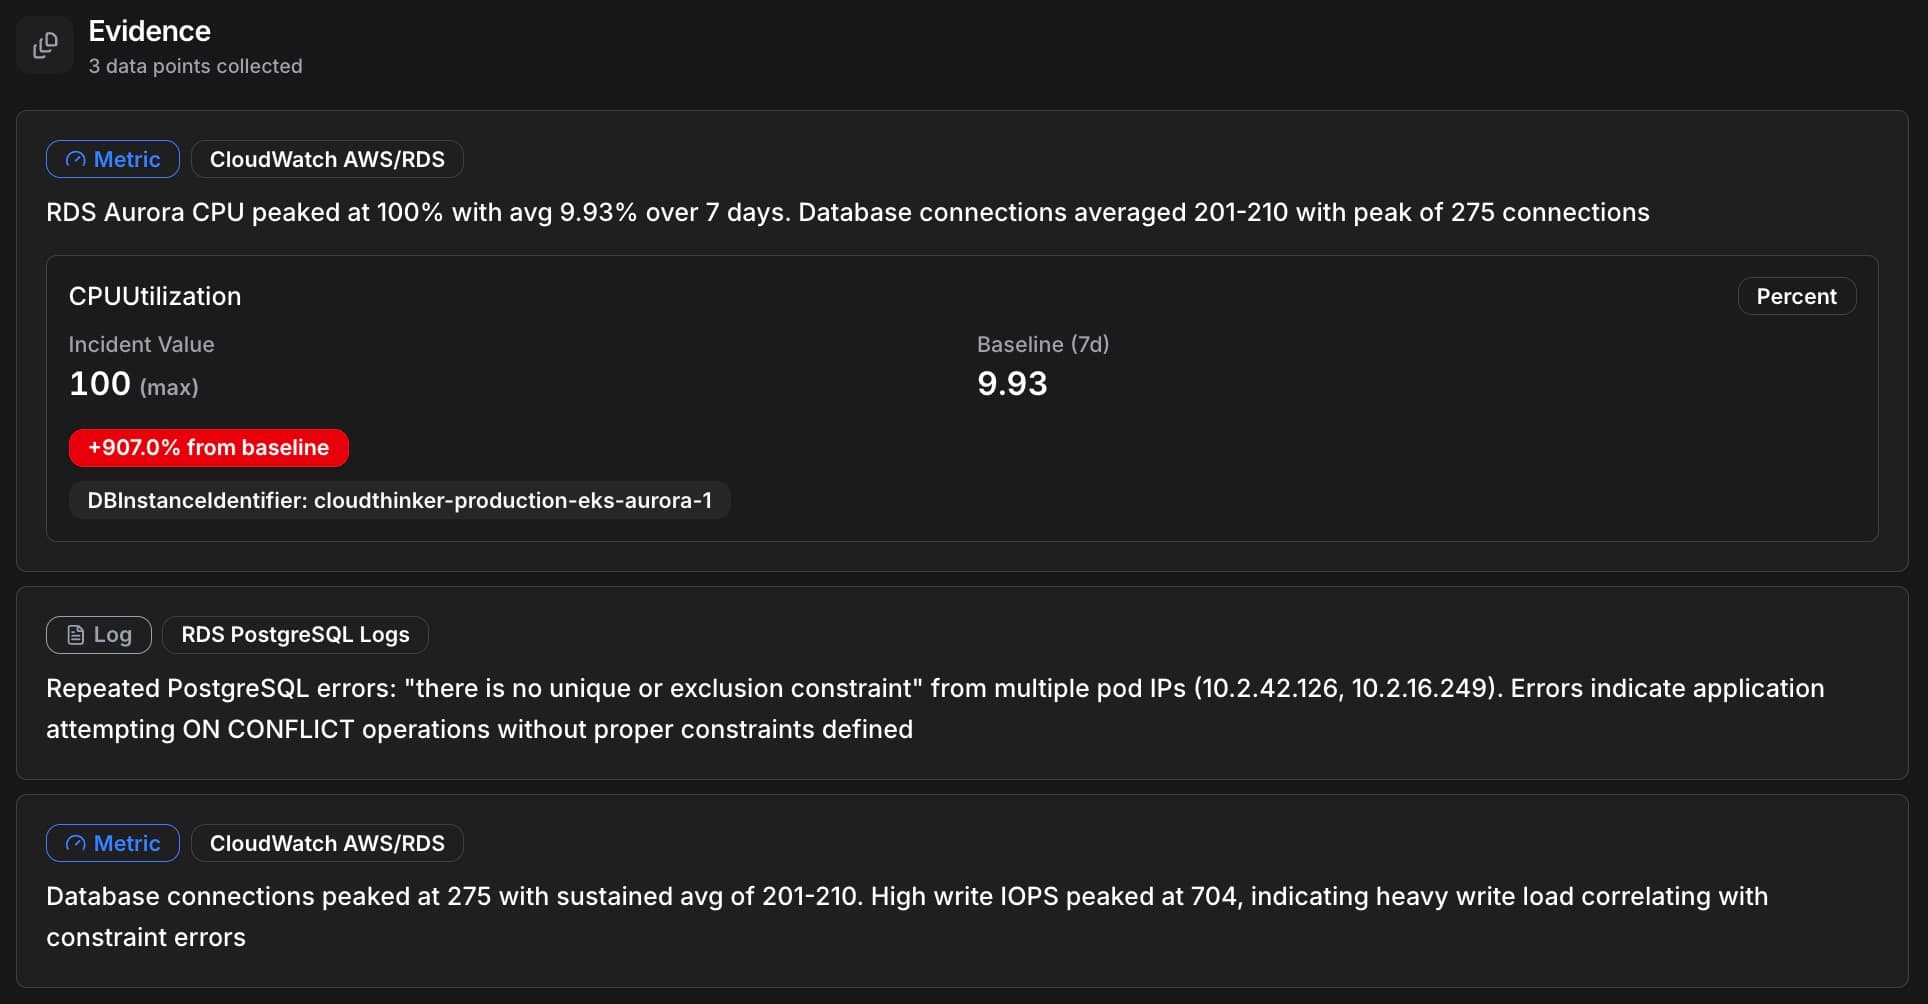
CloudThinker Evidence panel showing 3 collected data points: RDS Aurora CPU at 100% (+907% from baseline), PostgreSQL logs with constraint errors, and database connections peaking at 275
Rather than dumping raw data on your screen, the agent forms theories and tests them. It might hypothesize that database connection pool exhaustion was caused by a traffic spike, test against metrics, find traffic normal, and rule it out. Then hypothesize a connection timeout from misconfigured pool size after deployment, check deployment history, detect a config change 2 hours ago, correlate with error patterns, and confirm the root cause—all automatically.
Every finding comes with a confidence score from 0-100%, so you know what to trust. The agent doesn't just identify problems—it suggests 1-3 prioritized remediation actions ranked by impact and urgency.
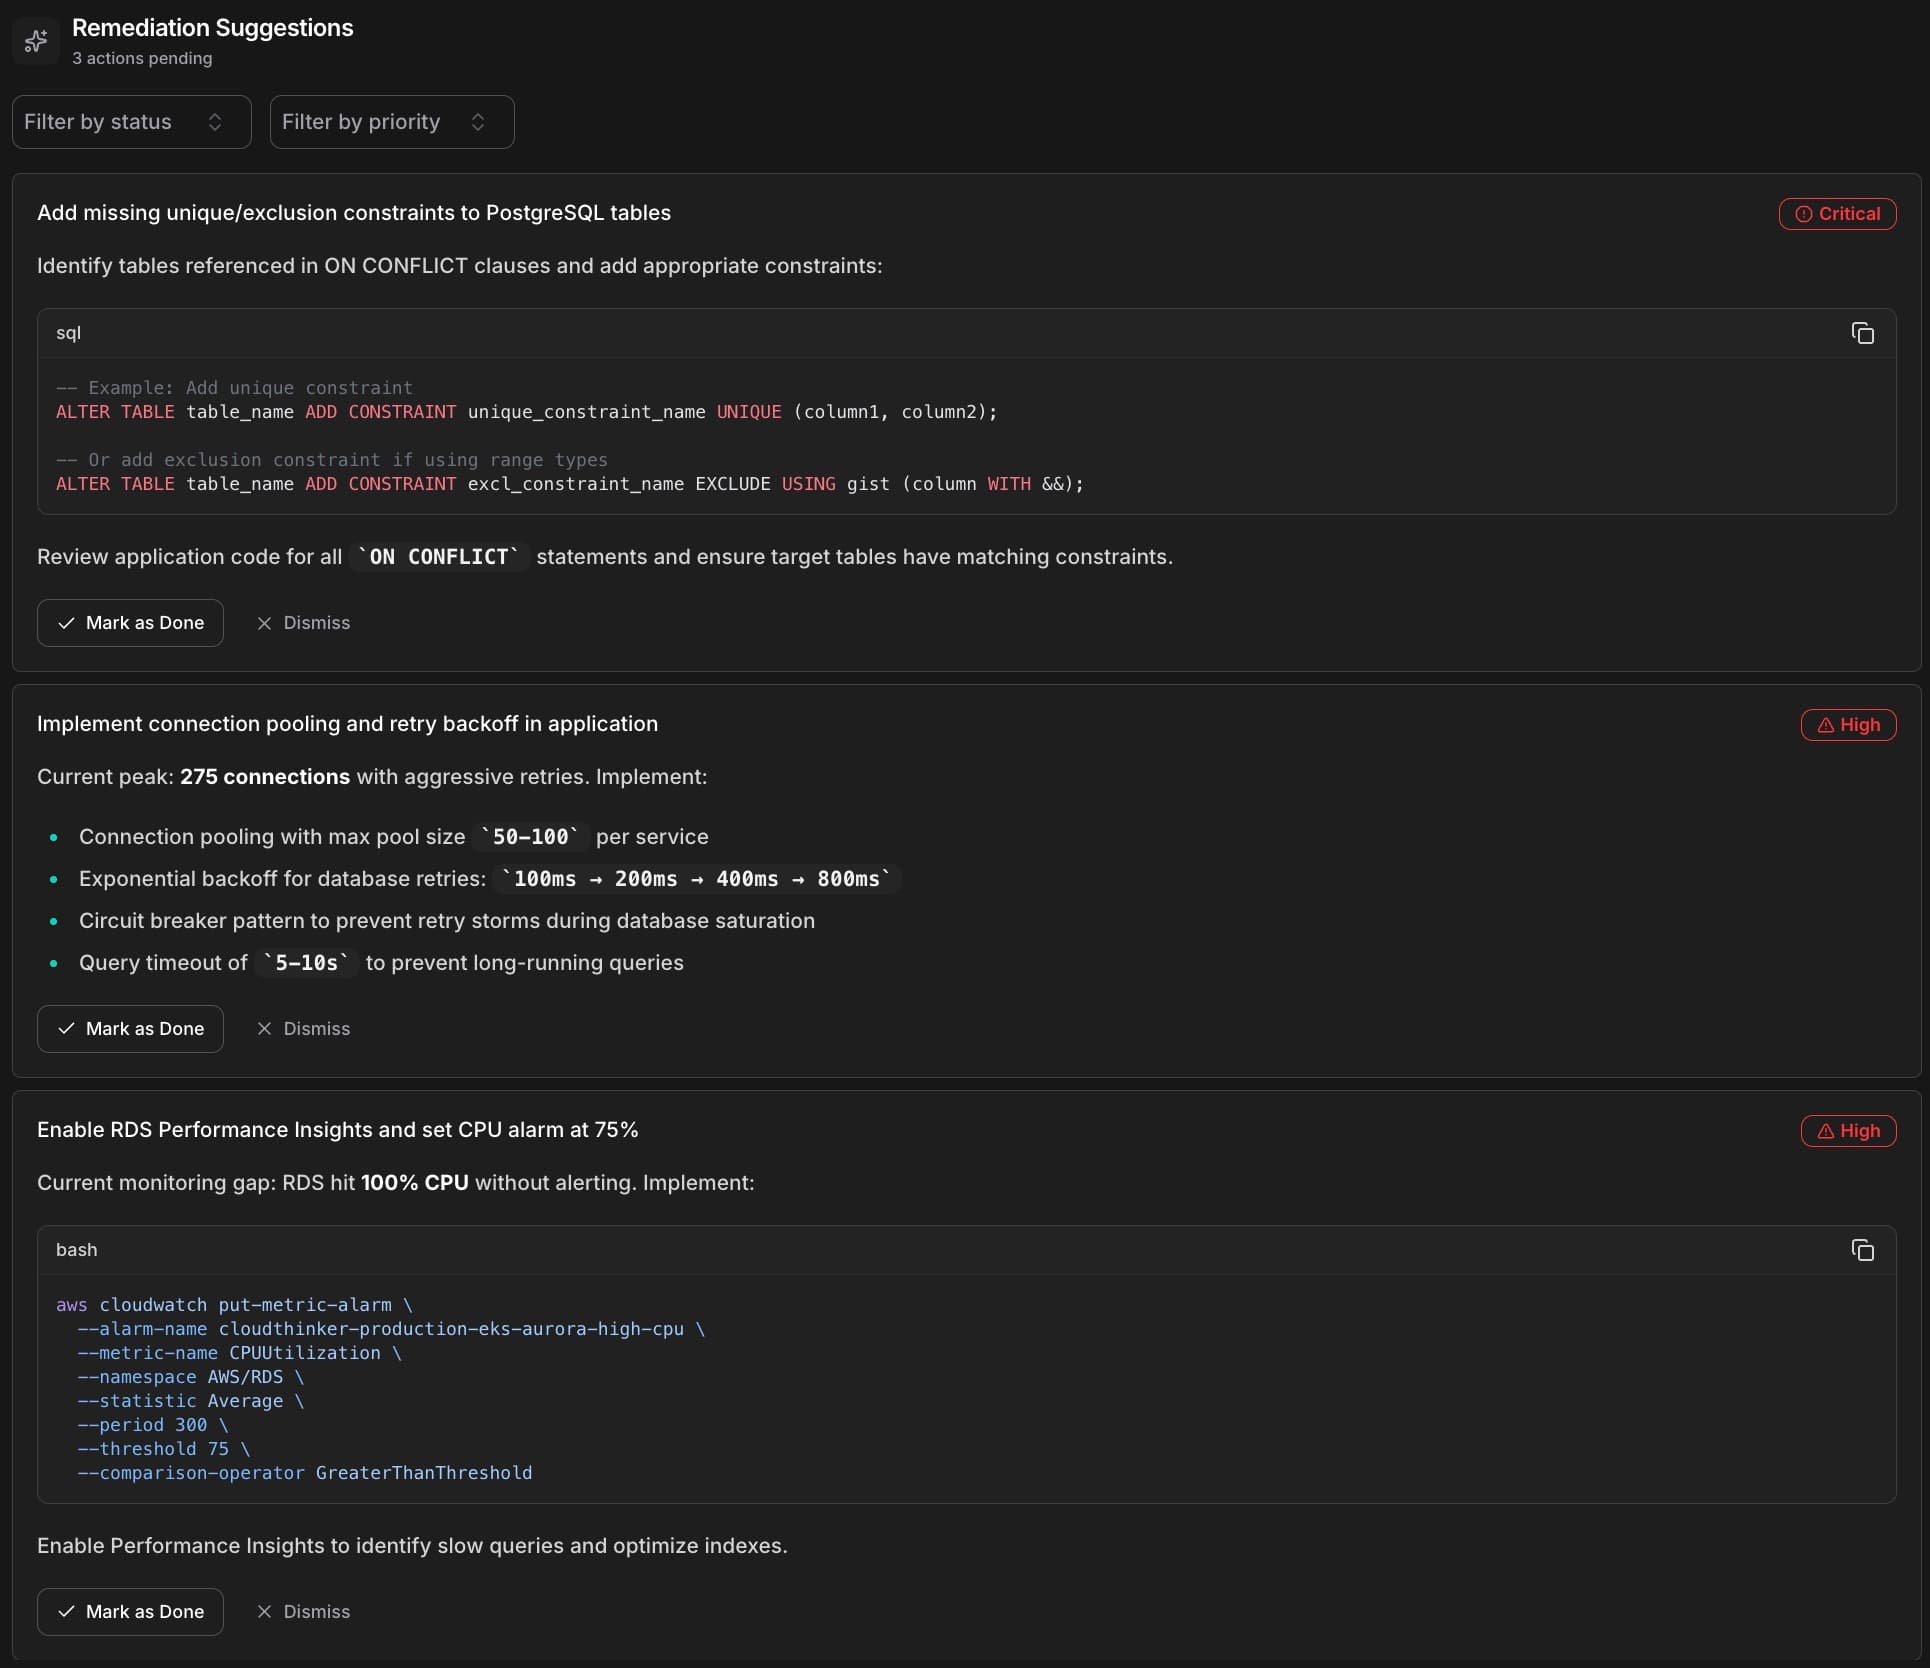
CloudThinker Remediation Suggestions showing prioritized actions: Critical SQL constraint fixes, High-priority connection pooling recommendations, and monitoring setup with code examples
Instead of spending 45 minutes hunting through dashboards, you get a clear root cause summary, the evidence chain that supports it, specific remediation steps, and a confidence level to guide your response. The AI thinks like your best senior engineer—the one who's seen every failure mode and knows exactly where to look first. Except it never sleeps, never forgets, and can investigate across your entire stack simultaneously.
2. Topology-Aware Intelligence
Most incident tools treat your infrastructure as a flat list of disconnected services. But your system isn't a list—it's a graph of interdependent components. CloudThinker understands this. When an alert fires, we don't just tell you which service is affected—we show you the blast radius, every upstream and downstream dependency that might be impacted.
When an incident arrives, CloudThinker automatically resolves affected components against your infrastructure topology. Service names map to topology nodes, hostnames resolve to their parent services, and cloud resource ARNs link to your dependency graph. No manual tagging required—the system understands your infrastructure.
Once we identify the affected service, we traverse your dependency graph to calculate impact: direct dependencies (services that call or are called by the affected component), transitive impact (second-order effects rippling through your system), and user impact estimation (how many active sessions or requests are at risk). "The database is down" becomes "The database is down, affecting 3 upstream API services, 2 background workers, and approximately 12,000 active user sessions."
See the blast radius rendered on an interactive topology map. Affected nodes highlight by severity. Dependencies show directionality. You grasp the full scope in seconds. Context changes everything—when you understand impact, you prioritize correctly.
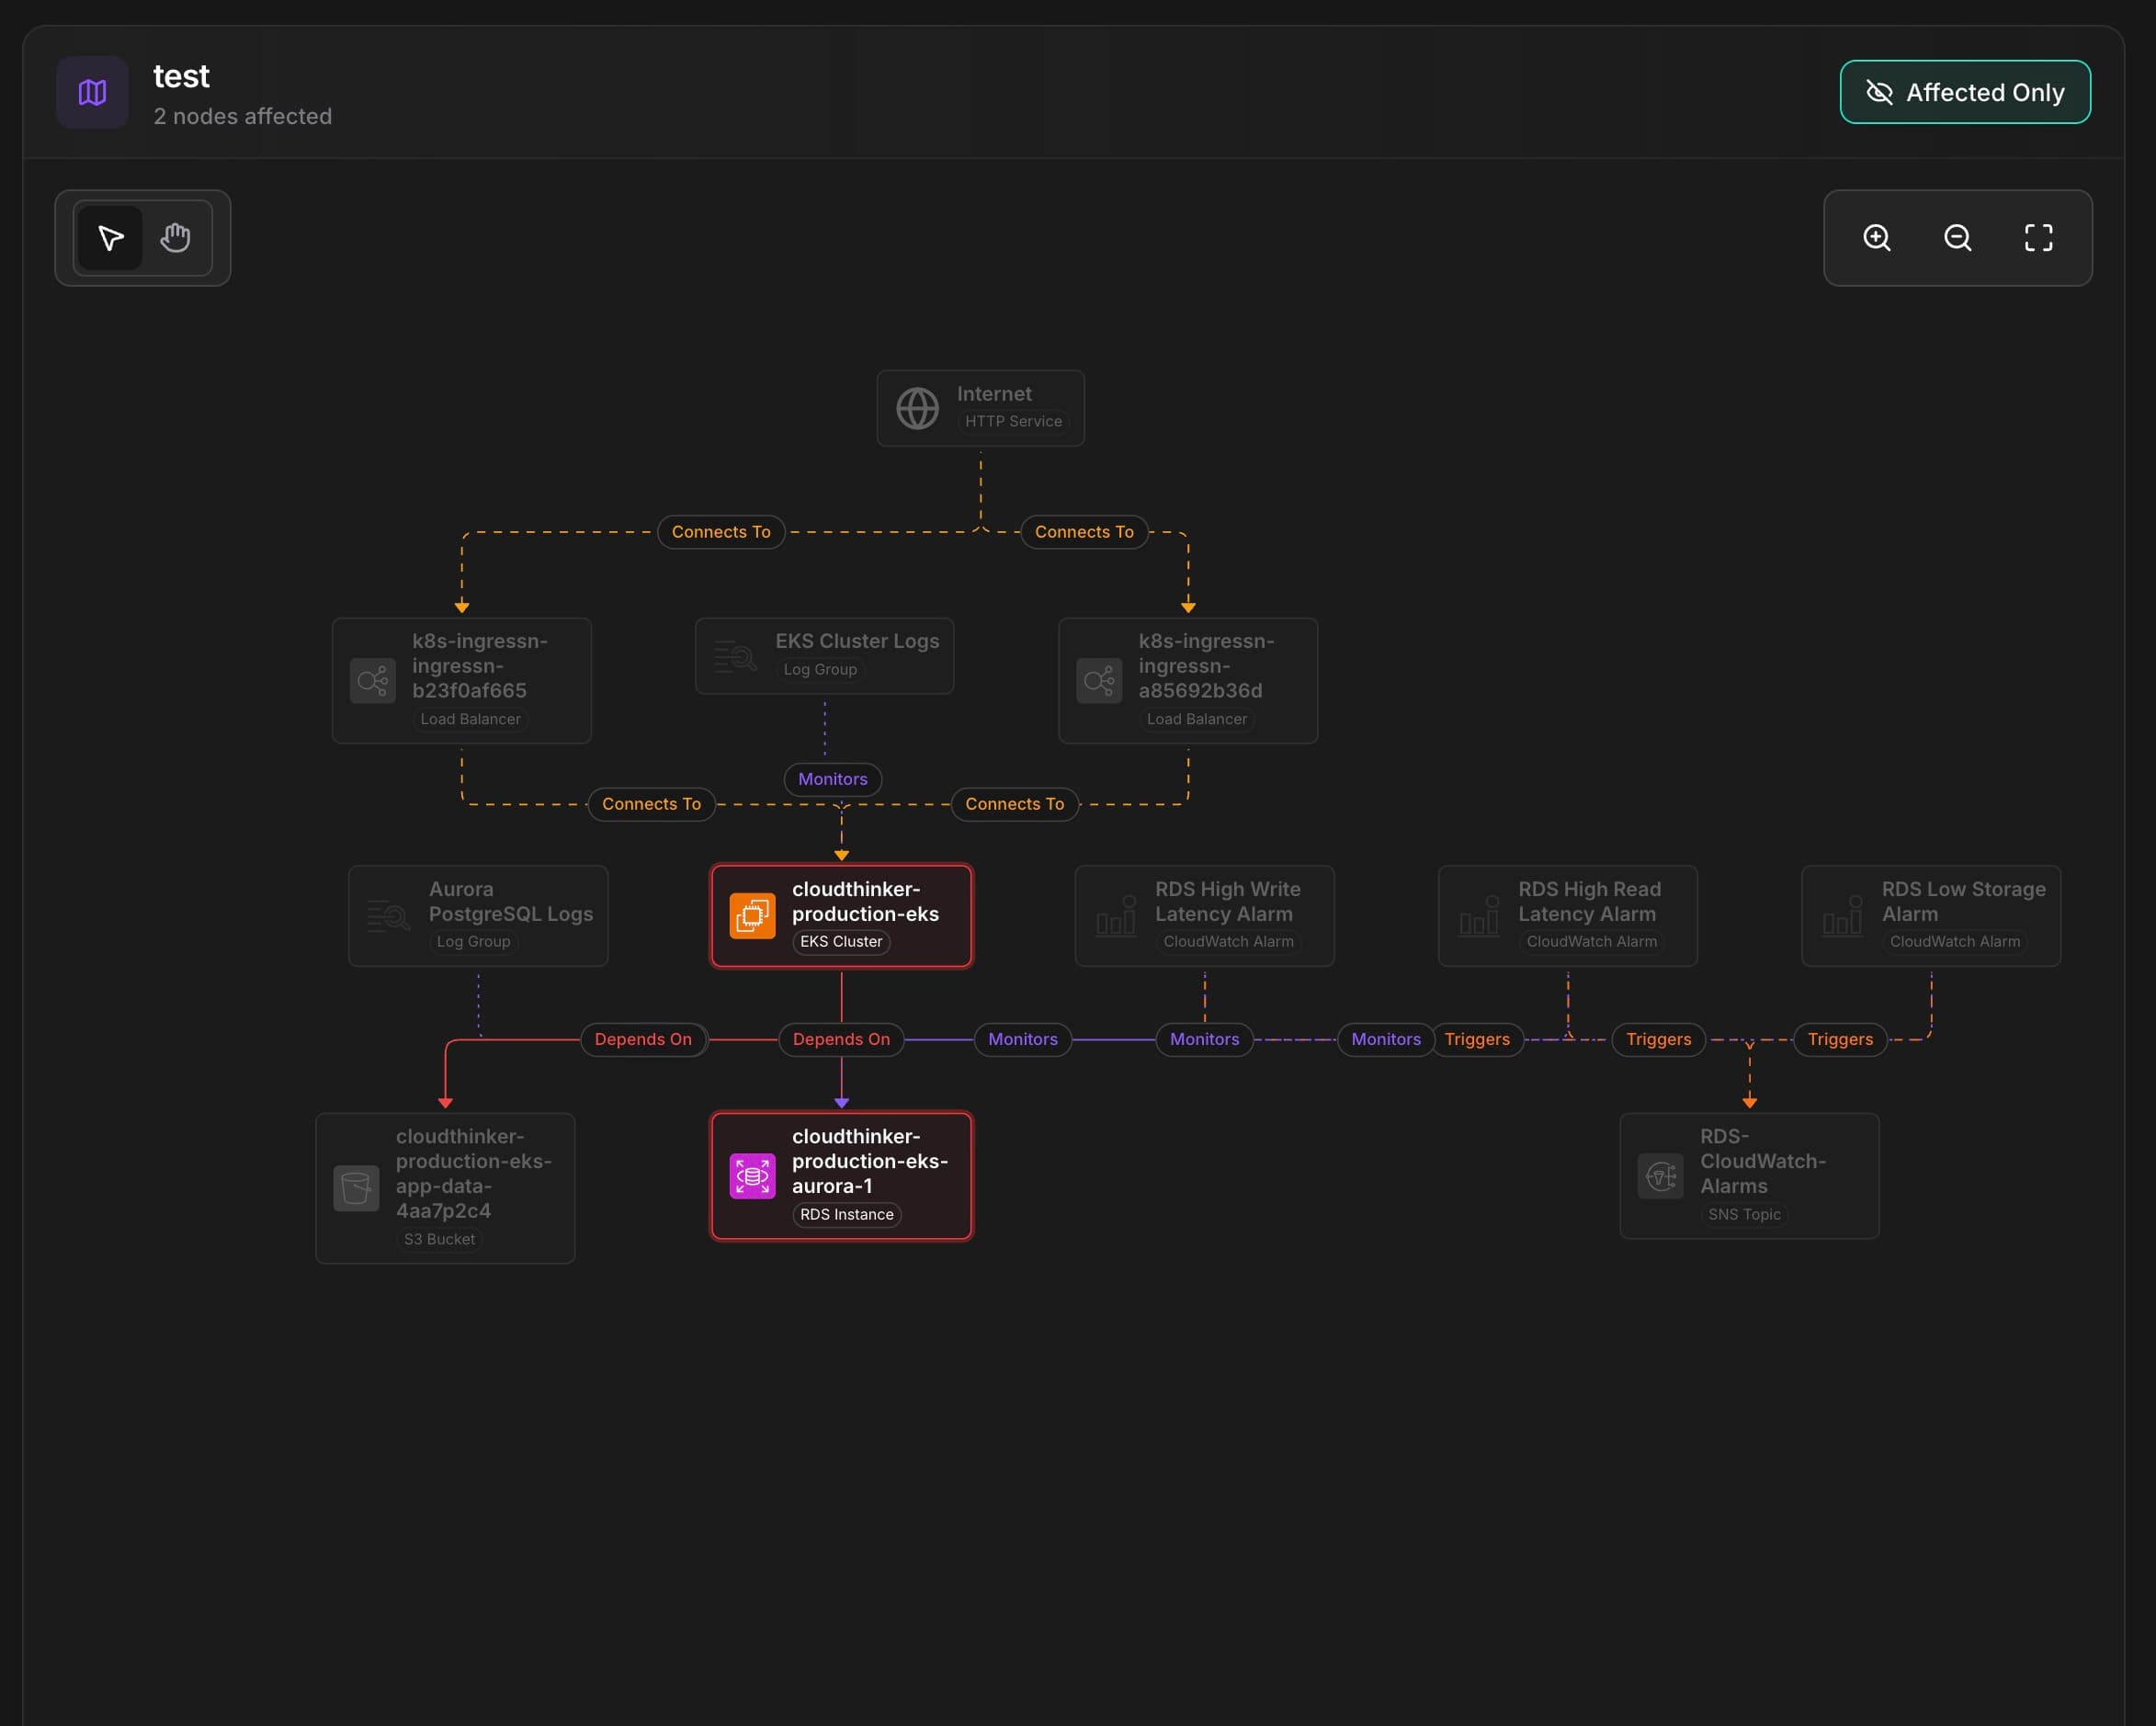
CloudThinker topology visualization showing blast radius with 2 affected nodes, dependency graph from Internet through load balancers to EKS cluster and Aurora database
3. Seamless Integrations
CloudThinker doesn't ask you to rip out your existing monitoring stack. We connect to it—deeply and bidirectionally.
Your monitoring tools can push alerts to CloudThinker via webhook with secure authentication (HMAC signatures, API keys, bearer tokens), flexible field mapping to normalize any payload format, and automatic payload validation. For deeper integration, CloudThinker connects directly to your monitoring platforms, enabling context fetching (pull additional metrics, logs, and traces during investigation), status synchronization (when you resolve an incident in CloudThinker, the status syncs back to the source), and enrichment with metadata from the originating platform.
CloudThinker integrates with observability platforms for metrics, logs, and traces; alerting systems for incident routing and escalation; cloud provider monitoring for native cloud metrics; and error tracking tools for application-level insights. We support 15+ platforms across these categories, with more added regularly. The goal isn't lock-in—it's amplification. Your existing tools become more powerful when CloudThinker's AI investigates their alerts.
Regardless of where alerts originate, CloudThinker provides a single pane of glass: all incidents in one timeline, consistent severity classification, unified search and filtering, and cross-platform correlation. No more jumping between five different consoles. One view. Complete picture.
Learn more about setting up integrations →
4. Continuous Learning
Every incident your team handles contains valuable signal. CloudThinker captures that signal and gets smarter over time.
The system identifies recurring issues across your incident history—similar error signatures that appeared before, time-based patterns (deploy day issues, traffic spike correlations), and service-specific failure modes. When a new incident matches a known pattern, investigation accelerates dramatically.
CloudThinker remembers what worked: which remediation actions resolved similar issues, how long different approaches took, and what false leads were ruled out. This institutional knowledge persists even as team members rotate.
The more incidents you resolve with CloudThinker, the better it understands your specific environment—which services are most interconnected, what "normal" looks like for your metrics, and where problems typically originate. The AI's first hypothesis becomes more accurate because it's learned your system's personality.
Key Capabilities
Beyond the four pillars, CloudThinker Incidents includes capabilities that streamline your entire incident workflow. Alert correlation automatically groups related alerts into a single incident—when multiple notifications fire for the same underlying issue, you see one investigation instead of twenty duplicates, with occurrence tracking and a 24-hour deduplication window that transforms noise into signal.
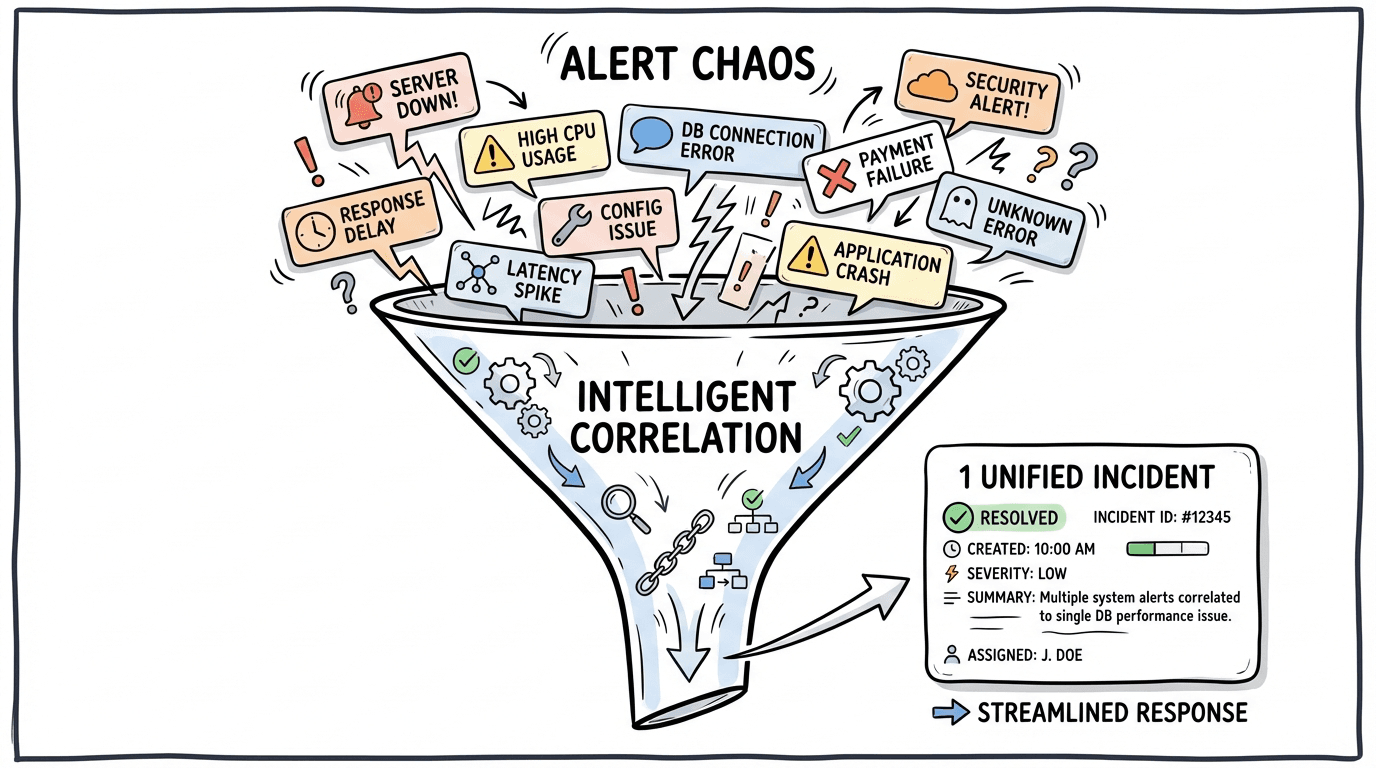
Alert chaos funnel showing multiple scattered alerts (server down, high CPU, latency spike, DB connection timeout) being intelligently correlated into 1 unified incident
Live Context lets you watch the AI investigate in real-time, showing the current phase, hypotheses being tested, evidence as it emerges, and confidence levels as they evolve—the reasoning is transparent, building trust through visibility.
When an incident reaches post-mortem status, CloudThinker automatically generates a comprehensive RCA report as a PDF containing the complete timeline, evidence chain, root cause summary, remediation actions, and blast radius visualization—ready to share with stakeholders or archive for compliance without manual documentation. Multi-channel notifications deliver alerts where your team works (email, Slack, or in-app), with user-configurable preferences and force-notifications for critical events. The platform supports a flexible incident lifecycle beyond the standard linear flow, allowing incidents to be marked as false alarms, put on hold, or reopened as understanding evolves—with every status change logged in a complete audit trail.
The CloudThinker Difference
Let's be direct about what makes this different from the incident tools you've used before:
| Traditional Approach | CloudThinker Incidents |
|---|---|
| Displays data, human investigates | AI investigates, human validates |
| Flat service list | Topology-aware blast radius |
| One-way alert ingestion | Bidirectional sync with source tools |
| Knowledge leaves with employees | Continuous learning persists |
| Manual post-mortem documentation | Auto-generated RCA reports |
| Alert flood during outages | Intelligent correlation and dedup |
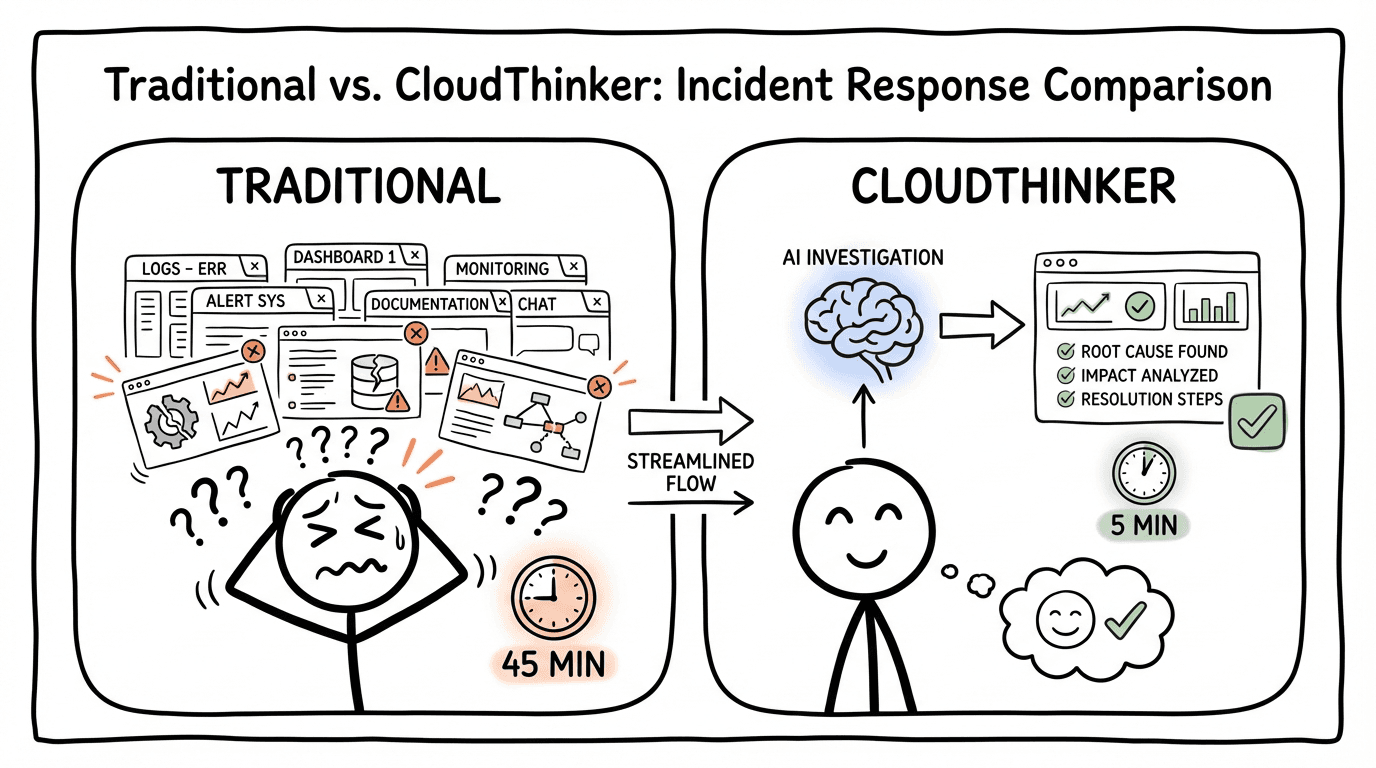
Side-by-side comparison: Traditional approach with stressed engineer juggling multiple dashboards for 45 minutes versus CloudThinker's AI-powered streamlined investigation completing in 5 minutes
We're not incrementally improving the old model. We're proposing a new one: AI as investigator, human as decision-maker.
How It Works in Practice
Here's a typical flow when an incident hits:
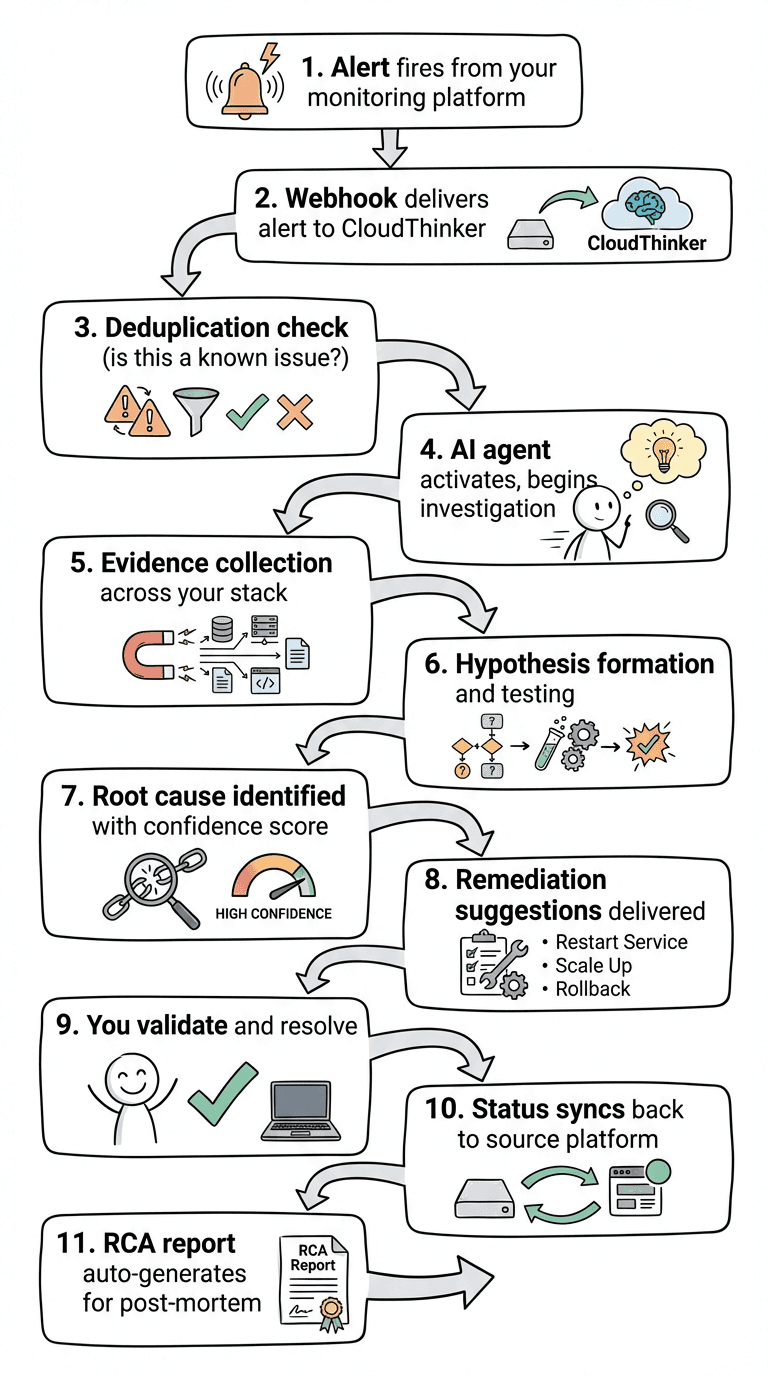
CloudThinker Incidents flow
From alert to root cause in minutes, not hours. From chaos to clarity.
Getting Started
CloudThinker Incidents is available today for all CloudThinker customers.
Setup takes minutes:
- Navigate to Incidents in your CloudThinker dashboard
- Complete the onboarding wizard (4 quick steps)
- Connect your first integration via webhook or full connection
- Configure your default topology view for blast radius analysis
That's it. The next alert that fires will trigger AI-powered investigation automatically.
The Bottom Line
Incident management has been stuck in the same paradigm for too long: humans doing detective work while tools display data.
CloudThinker Incidents inverts that model. The AI investigates. You decide and act.
Your 3 AM self will thank you.
Ready to transform your incident response?
Get Started with CloudThinker Incidents →
CloudThinker Incidents is available now for all CloudThinker platform customers. Contact your account team or visit our documentation to begin setup.